Daycare Budget Template
Plan and track your daycare's finances with a budget template built for childcare centers. Pre-loaded with tuition revenue, payroll, and subsidy categories — with formulas that calculate occupancy rate and labor cost ratio automatically.
What's Inside This Daycare Budget Template
This template includes 5 worksheets, each designed for a specific part of your daycare financial workflow:
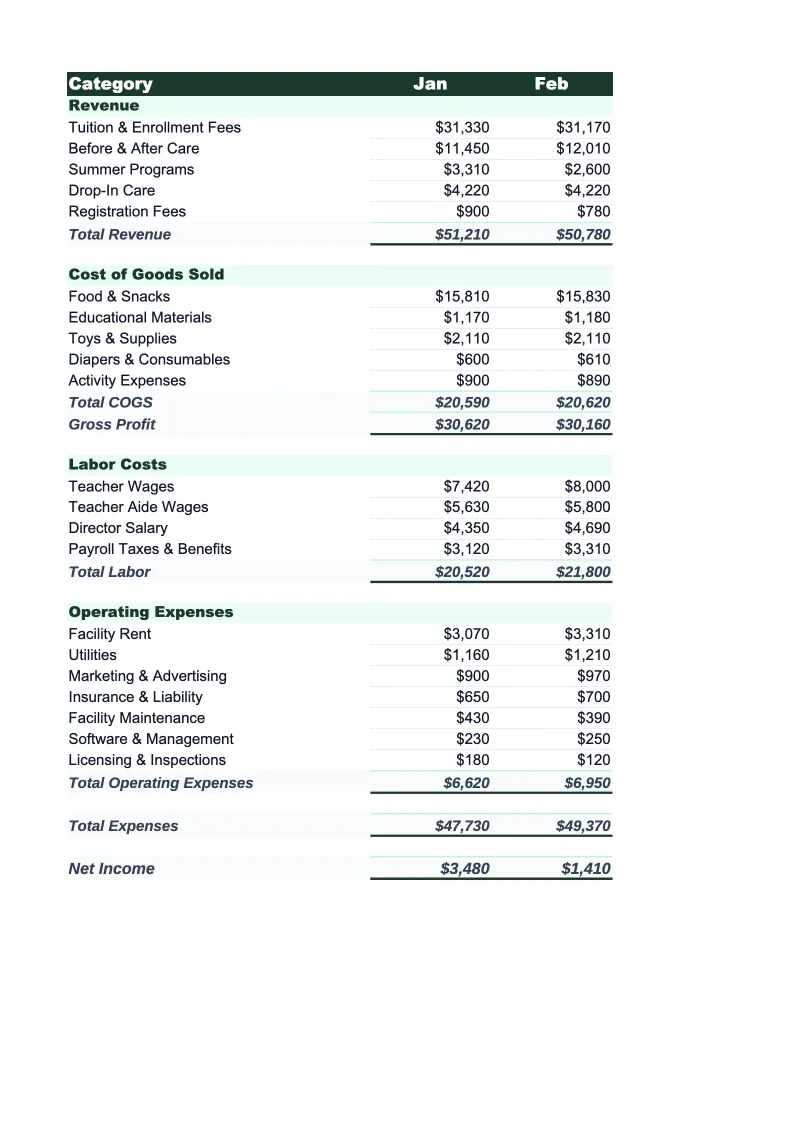
Monthly Budget
The core worksheet where you plan each month's revenue and expenses for your childcare center.
Annual Summary
A 12-month rollup that pulls from each monthly sheet automatically.
Budget vs Actual
Track what you planned against what actually happened.
Enrollment Tracker
A roster-level view of your center's enrollment capacity and current occupancy across all age groups and classrooms.
Dashboard
A visual overview with pre-built charts showing occupancy rate, labor cost ratio, revenue by source (tuition vs.
Daycare Budget Template Features
- Revenue split by age group, enrollment type, and subsidy vs. private-pay
- Payroll tracking by role — lead teachers, assistants, director, and admin
- Occupancy rate auto-calculation against licensed classroom capacity
- Labor cost ratio calculation (industry target: below 65% of revenue)
- Food program costs tracked separately for CACFP reimbursement reporting
- 12-month annual rollup with dashboard for licensing and lender review
How to Use This Daycare Budget Spreadsheet
Getting started takes about 15 minutes. Download the .xlsx file and open it in Excel or Google Sheets — no macros or plugins required. Start with the Monthly Budget sheet and review the pre-loaded categories. Most daycare owners keep the expense categories as-is and spend their setup time on the revenue side: enter your licensed capacity and current enrollment by age group, confirm your tuition rates for each room, and add any subsidy or voucher programs you participate in. The formulas calculate occupancy rate and projected revenue from there.
Once your baseline is set, work through the expense side. Payroll is almost always your largest line item — enter your staffing by role and whether each position is full-time or part-time. Add your rent, food program costs, insurance, and supplies. If you're not sure on some numbers, use last month's bank statements and QuickBooks or your accounting software as a reference. The goal on day one is a reasonable starting point, not perfect accuracy.
15 minutes from download to your first daycare budget
Download the template, plug in your enrollment and tuition rates, and see your center's full financial picture — occupancy rate, labor cost ratio, and 12-month rollup included.
Why Every Childcare Center Needs a Budget Template
Childcare center budgeting is hard because revenue and costs move in ways that don't always line up. Tuition comes in on a weekly or monthly schedule, but subsidy payments from state and federal programs often arrive weeks late. Payroll goes out every two weeks regardless. Enrollment spikes in August and January, drops in summer for school-age programs, and every withdrawal from an infant room immediately hits your bottom line because infant ratios are expensive to staff and hard to backfill quickly. Centers that don't budget at the line-item level often discover cash flow problems only when payroll is due.
The numbers that matter most in childcare are occupancy rate and labor cost ratio. Occupancy should run between 85% and 95% of licensed capacity — below that, you're paying for staff and space you're not monetizing. Labor cost should stay below 65% of revenue; most healthy centers run 55–62%. Gross margins of 30–50% are typical, but net margins after overhead and licensing costs usually land in the 10–16% range. If you don't know these numbers for your center right now, that's exactly the gap this template fills.
Daycare Industry at a Glance
Financial templates built for daycare centers and childcare providers — pre-loaded with tuition billing categories, subsidy tracking, and the KPIs that determine whether a center is actually making money.
Revenue Drivers
- Weekly/monthly tuition by age group
- Government subsidies and voucher programs
- Before/after school care
- Drop-in and part-time care
- Enrichment classes and summer programs
Key Cost Categories
- Payroll and benefits (50-70% of revenue)
- Rent and occupancy
- Food and meals program
- Supplies and curriculum materials
- Insurance and licensing
- Utilities
- Marketing and enrollment
Typical Margins
Gross: 30-50% · Net: 10-16%
Seasonality
Peak enrollment in August-September (school year start) and January-February. Summer dip for school-age programs. Revenue is more stable than attendance because most centers bill flat tuition regardless of days attended.
Key Performance Indicators
Daycare Budget Template FAQ
More Daycare Templates
Daycare Balance Sheet Template for Excel
$29
Daycare Business Plan Template for Excel
$39
Daycare Cash Flow Template for Excel
$29
Daycare Expense Tracker Template for Excel
$29
Daycare Financial Model Template for Excel
$29
Daycare Income Statement Template for Excel
$29
Daycare Invoice Template for Excel
$29
Daycare KPI Dashboard Template for Excel
$29
Daycare P&L Template for Excel
$29
Daycare Pro Forma Template for Excel
$29
Daycare Project Budget Template for Excel
$29
Daycare Sales Forecast Template for Excel
$29
Daycare Business Valuation Template for Excel
$29
Daycare Budget Template
$29