Daycare Income Statement Template
Report your daycare's revenue, labor costs, and net income with an income statement built for childcare centers — pre-loaded with tuition, subsidy, and age-group categories.
What's Inside This Daycare Income Statement Template
This template includes 4 worksheets, each designed for a specific part of your daycare financial workflow:
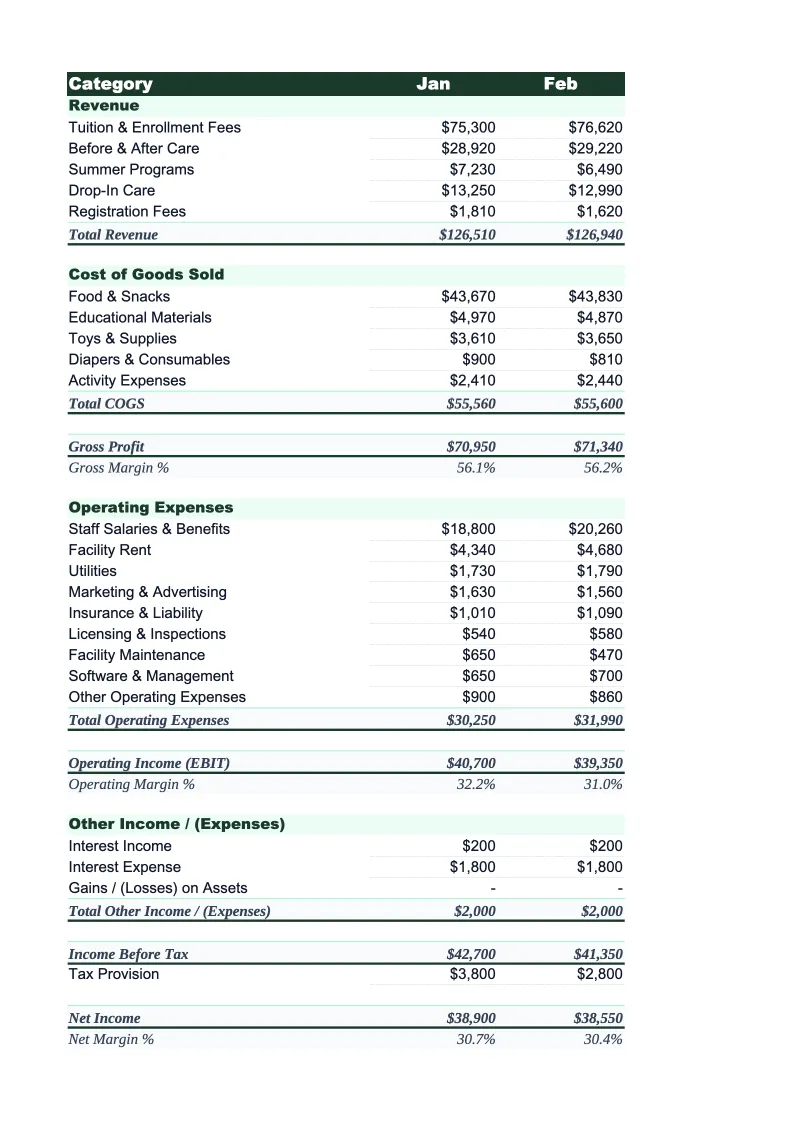
Monthly Income Statement
The core worksheet where you record each month's revenue and expenses using daycare-specific line items.
Annual Summary
A 12-month rollup that pulls from each monthly sheet automatically.
Enrollment & Revenue Breakdown
A supporting worksheet that ties enrollment numbers to revenue figures.
Dashboard
A visual overview with pre-built charts showing the metrics that matter most for childcare operations: labor cost ratio (target below 65% of revenue), occupancy rate, monthly net income trend, and the revenue split between tuition and subsidies.
Daycare Income Statement Template Features
- Revenue broken out by age group (infant, toddler, preschool, school-age) and funding type
- Subsidy and voucher income tracked separately from private tuition
- Labor cost ratio auto-calculated against total revenue (target below 65%)
- Occupancy rate and revenue per enrolled child calculations
- 12-month annual summary in standard income statement format
- Dashboard with charts for labor ratio, occupancy, and net income trends
How to Use This Daycare Income Statement Spreadsheet
Start by opening the Enrollment & Revenue Breakdown sheet and entering your licensed capacity and current enrollment by age group. This takes about 10 minutes and sets the foundation for your revenue figures. Then move to the Monthly Income Statement: review the pre-loaded categories and adjust any line items that don't match your center's chart of accounts. Most directors keep the structure as-is and just rename a subsidy program or split out a specific expense category.
Once the categories are set, enter your actual revenue and expenses for the current month. Use your accounting software export or bank statements as your source — you don't need to reconcile to the penny on day one. The formulas calculate gross profit, operating income, and net income automatically, and the ratios update instantly so you can see your labor cost percentage and subsidy mix as you enter data. Copy the monthly sheet forward for remaining months and adjust for known enrollment changes or seasonal dips.
15 minutes from download to your first income statement
Download the template, plug in your enrollment and expense numbers, and see your daycare's full financial picture — monthly income statement, annual summary, and occupancy metrics included.
Why Every Daycare Needs an Income Statement Template
Daycare centers operate on narrow margins — typically 10–16% net — and the single biggest lever is labor. Staff payroll and benefits usually consume 50–70% of revenue, which means a childcare income statement looks very different from a retail or services business. Most operators know their enrollment numbers and their tuition rates, but without a structured income statement, it's easy to miss that labor crept from 58% of revenue to 65% over six months while everything else held steady. That difference between 58% and 65% on $400,000 of annual revenue is $28,000 — enough to wipe out the year's profit.
A properly structured daycare income statement separates revenue by age group and funding type because the economics are different. Infant rooms are the most expensive to staff (lower ratios required by licensing), so infant tuition rates are higher but so are the labor costs to serve them. Subsidy income from state and federal programs tends to be reliable but pays below market rate in many states, which affects your blended revenue per child. Tracking these categories separately lets you model what happens when you shift your enrollment mix — more infants, more subsidy-funded spots, or adding a school-age before/after program.
Daycare Industry at a Glance
Financial templates built for daycare centers and childcare providers — pre-loaded with tuition billing categories, subsidy tracking, and the KPIs that determine whether a center is actually making money.
Revenue Drivers
- Weekly/monthly tuition by age group
- Government subsidies and voucher programs
- Before/after school care
- Drop-in and part-time care
- Enrichment classes and summer programs
Key Cost Categories
- Payroll and benefits (50-70% of revenue)
- Rent and occupancy
- Food and meals program
- Supplies and curriculum materials
- Insurance and licensing
- Utilities
- Marketing and enrollment
Typical Margins
Gross: 30-50% · Net: 10-16%
Seasonality
Peak enrollment in August-September (school year start) and January-February. Summer dip for school-age programs. Revenue is more stable than attendance because most centers bill flat tuition regardless of days attended.
Key Performance Indicators
Daycare Income Statement Template FAQ
More Daycare Templates
Daycare Balance Sheet Template for Excel
$29
Daycare Budget Template for Excel
$29
Daycare Business Plan Template for Excel
$39
Daycare Cash Flow Template for Excel
$29
Daycare Expense Tracker Template for Excel
$29
Daycare Financial Model Template for Excel
$29
Daycare Invoice Template for Excel
$29
Daycare KPI Dashboard Template for Excel
$29
Daycare P&L Template for Excel
$29
Daycare Pro Forma Template for Excel
$29
Daycare Project Budget Template for Excel
$29
Daycare Sales Forecast Template for Excel
$29
Daycare Business Valuation Template for Excel
$29
More Income Statement Templates
Accounting Firm Income Statement Template for Excel
$29
Auto Repair Income Statement Template for Excel
$29
Car Wash Income Statement Template for Excel
$29
Church Income Statement Template for Excel
$29
Cleaning Service Income Statement Template for Excel
$29
Coffee Shop Income Statement Template for Excel
$29
Daycare Income Statement Template
$29