Food Truck Income Statement Template
A food truck income statement template with street sales, catering revenue, commissary fees, and fuel costs already built in — so you can see your actual margins without starting from a blank spreadsheet.
What's Inside This Food Truck Income Statement Template
This template includes 4 worksheets, each designed for a specific part of your food truck financial workflow:
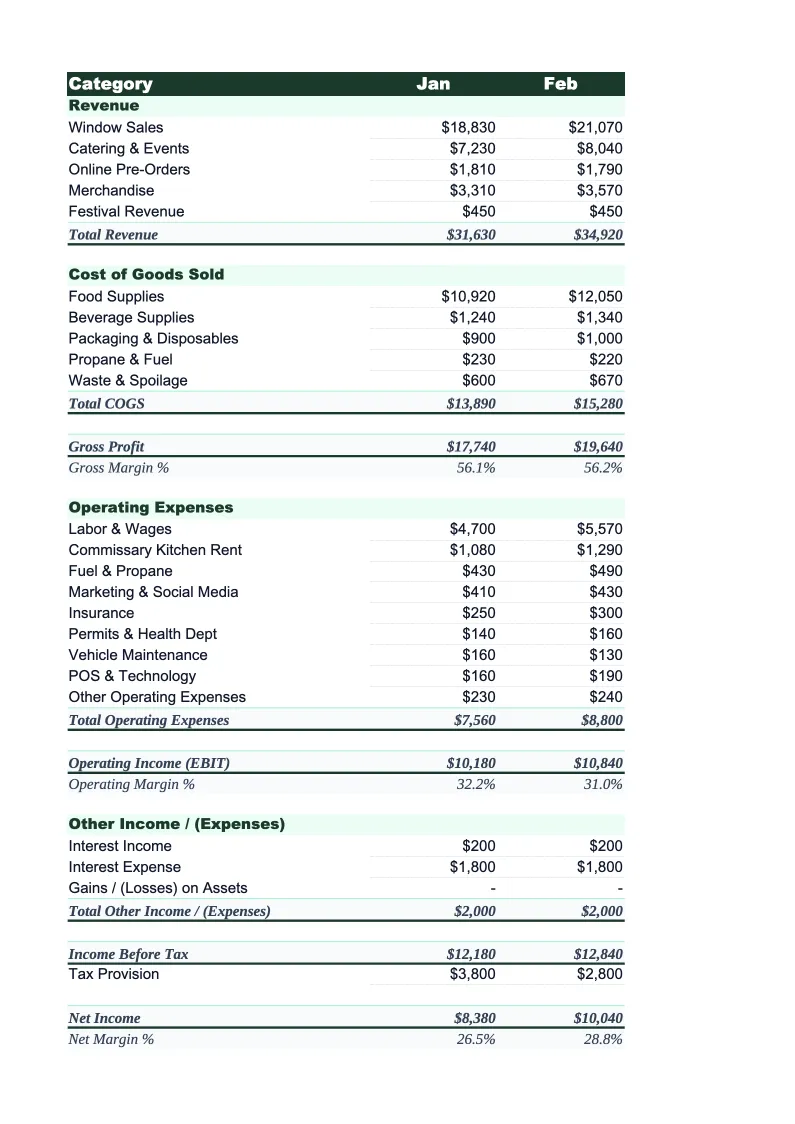
Monthly Income Statement
The core P&L worksheet structured around how food truck revenue actually flows.
Annual Summary
A 12-month rollup that pulls from each monthly income statement automatically.
Key Ratios
A dedicated tracker for the financial ratios that matter most in the food truck business.
Event & Location Tracker
A supplemental sheet for tracking profitability by individual service location or event.
Food Truck Income Statement Template Features
- Revenue split by street sales, catering, corporate events, and festivals
- Commissary kitchen fees tracked as a separate line item with % of revenue
- Food cost percentage calculated automatically each month
- Revenue per service day metric for evaluating locations and events
- 12-month annual summary with seasonal trend visibility
- Event and location profitability tracker to identify your best stops
How to Use This Food Truck Income Statement Spreadsheet
Start by downloading the .xlsx file and opening it in Excel or Google Sheets — no macros or add-ins required. Open the Monthly Income Statement sheet and review the pre-loaded revenue and expense categories. For most food trucks, the structure needs minimal adjustment: rename the street sales line to match your route name, add or remove catering channels based on what you actually do, and adjust the commissary fee line if you pay rent differently than per-use. This initial setup takes about 10 minutes and you won't need to redo it.
Each month, enter your revenue by channel from your square or POS summary report, then work down through food cost, packaging and supplies, commissary fees, fuel, permits, labor, and the remaining expenses. The gross profit, food cost percentage, and net income lines calculate automatically. Once the monthly sheet is complete, the Annual Summary and Key Ratios sheets update without any additional steps. The Event and Location Tracker is worth filling out at the end of each service day — it only takes 30 seconds per entry and builds up data you'll rely on when planning routes for the following season.
15 minutes from download to your first income statement
Download the template, enter your revenue and costs, and see your food truck's actual margins — food cost percentage, commissary ratio, and net income all calculated automatically.
Why Every Food Truck Needs a Proper Income Statement
Food trucks operate with a cost structure that looks simpler than a restaurant but is actually harder to manage. You have the same food cost pressure as any food service business — most trucks run food cost at 28–35% of revenue — but layered on top is a set of costs with no restaurant equivalent: commissary kitchen fees (typically 6–12% of revenue), fuel and vehicle maintenance, permit and licensing fees in every jurisdiction you operate, and the revenue volatility that comes from being weather-dependent. A bad week of rain in May doesn't just slow sales — it throws off your commissary cost ratio for the whole month because your fixed-ish costs hit a lower revenue base.
The income statement is where you separate actual profit from the feeling of a busy day. Food trucks that do $1,500 on a Friday festival are not necessarily more profitable than ones doing $800 at a reliable corporate lunch stop if the festival required $120 in event fees, more fuel, higher waste from unpredictable volume, and extra labor hours. Tracking revenue by channel — street sales, catering events, festivals, corporate stops — gives you the visibility to make those comparisons. Food cost percentage by channel is the next level: private catering events often allow for tighter menu control and lower waste, while high-volume festival service can push food cost up from over-portioning under pressure.
Food Truck Industry at a Glance
Financial templates built for food truck operators — from single-unit street vendors to multi-truck fleets. Pre-loaded with commissary fees, fuel costs, permit categories, and event-based revenue tracking.
Revenue Drivers
- Street service (lunch/dinner stops)
- Private catering events
- Corporate events
- Food truck rallies and festivals
Key Cost Categories
- Food costs (COGS)
- Commissary kitchen fees
- Fuel and vehicle maintenance
- Permits and licenses
- Labor
- Payment processing and POS fees
Typical Margins
Gross: 60-70% · Net: 6-15%
Seasonality
Peak revenue in spring and summer; heavily weather-dependent. Winter months significantly slower in northern climates. Event catering provides revenue stability year-round.
Key Performance Indicators
Food Truck Income Statement Template FAQ
More Food Truck Templates
Food Truck Balance Sheet Template for Excel
$29
Food Truck Budget Template for Excel
$29
Food Truck Business Plan Template for Excel
$39
Food Truck Cash Flow Template for Excel
$29
Food Truck Expense Tracker Template for Excel
$29
Food Truck Financial Model Template for Excel
$29
Food Truck Invoice Template for Excel
$29
Food Truck KPI Dashboard Template for Excel
$29
Food Truck P&L Template for Excel
$29
Food Truck Pro Forma Template for Excel
$29
Food Truck Project Budget Template for Excel
$29
Food Truck Sales Forecast Template for Excel
$29
Food Truck Valuation Template for Excel
$29
More Income Statement Templates
Accounting Firm Income Statement Template for Excel
$29
Auto Repair Income Statement Template for Excel
$29
Car Wash Income Statement Template for Excel
$29
Church Income Statement Template for Excel
$29
Cleaning Service Income Statement Template for Excel
$29
Coffee Shop Income Statement Template for Excel
$29
Food Truck Income Statement Template
$29