Manufacturing Balance Sheet Example: A Line-by-Line Breakdown
A complete manufacturing balance sheet example with real line items, three-layer inventory explained, PP&E benchmarks, and what lenders look for.
The defining feature of a manufacturing balance sheet isn't cash, equipment, or debt. It's inventory — and not just one inventory number, but three.
While a retailer lists "merchandise inventory" as a single line item, a manufacturer carries raw materials, work-in-process, and finished goods separately. Each represents a different stage of production, a different cost burden, and a different kind of financial risk. WIP inventory, for example, includes not just the cost of the raw materials that went in, but also the labor hours and overhead allocated to those units — costs that evaporate if production is interrupted.
That three-layer inventory structure, combined with heavy equipment and the accounting mechanics that come with it, is what makes manufacturing balance sheets read differently from every other industry.
What Makes Manufacturing Different on a Balance Sheet
Every balance sheet covers the same three sections: assets, liabilities, and equity. The equation is always Assets = Liabilities + Equity. But for manufacturers, the weight and composition of those sections look substantially different.
Three inventory accounts instead of one. This is the signature characteristic. Each layer carries a different cost:
- Raw materials — inputs purchased but not yet entered into production. Valued at purchase cost.
- Work-in-process (WIP) — units currently in production. Valued at raw material cost plus direct labor to date plus allocated manufacturing overhead (factory rent, equipment depreciation, utilities, indirect labor).
- Finished goods — completed units ready for sale. Fully burdened with all production costs.
The WIP and finished goods lines are larger and more complex than they appear because overhead allocation is embedded in them. A 10% reduction in factory overhead rates can materially change the inventory balance even without a single unit changing hands.
PP&E is a major asset class. Manufacturers own factories, production lines, CNC machines, stamping presses, furnaces, and specialized tooling. For a small-to-mid manufacturer, property, plant, and equipment (PP&E) often represents 30–50% of total assets. That's a fundamentally different balance sheet profile than a service business or SaaS company.
Deferred tax liabilities are normal and expected. Manufacturers depreciate equipment using straight-line methods for their financial statements but accelerated MACRS methods for tax purposes. The resulting timing difference shows up on the balance sheet as a long-term deferred tax liability — a normal feature of capital-intensive businesses, not a warning sign.
Heavy use of debt financing. Equipment financing, term loans, and revolving lines of credit against receivables and inventory are standard for manufacturers. The industry median debt ratio (total liabilities / total assets) is approximately 0.51, meaning about half of assets are financed by debt — reasonable for the capital intensity involved.
The Three Sections: What Goes Where
Assets
Current assets — convertible to cash within 12 months:
- Cash and cash equivalents — operating accounts and short-term deposits. Manufacturers tend to hold more cash than retailers because production disruptions are expensive; running out of raw materials mid-cycle is far costlier than a brief stockout at a retail register.
- Accounts receivable (net) — B2B manufacturers commonly offer 30–60 day payment terms to their customers, making AR a significant current asset. The allowance for doubtful accounts offsets any expected uncollectible balances.
- Raw materials inventory — purchased inputs awaiting production. Steel coil, plastic resin, lumber, chemicals — whatever the starting material is. Valued at purchase cost.
- Work-in-process inventory — partially manufactured goods. The value here includes raw material cost, direct labor, and allocated overhead through the current stage of production.
- Finished goods inventory — completed units. Carrying full production cost.
- Prepaid expenses — insurance premiums, maintenance contracts, prepaid freight.
Long-term assets — owned assets that won't convert to cash within 12 months:
- Land — recorded at cost; never depreciated.
- Buildings and plant facilities — factory structures, warehouses. Depreciated straight-line over 20–40 years for book purposes.
- Production machinery and equipment — the core operating assets. Depreciated over 7–15 years for book purposes.
- Tooling and dies — can be capitalized separately if useful life exceeds one year; often depreciated using the units-of-production method (cost per thousand cycles, for example).
- Vehicles — forklifts, delivery trucks, company vehicles.
- Less: accumulated depreciation — the total depreciation recognized to date across all depreciable assets. Shown as a contra-asset that reduces gross PP&E to net book value.
- Construction in progress (CIP) — assets being built or installed that aren't yet in service. Not yet being depreciated.
Liabilities
Current liabilities — due within 12 months:
- Accounts payable — outstanding invoices to raw material suppliers and vendors. Net 30 is the most common baseline in U.S. manufacturing supply chains; larger operations often negotiate net 45–60 with key suppliers.
- Accrued wages — factory labor and overtime earned but not yet paid.
- Accrued manufacturing overhead — utilities, production supplies, and indirect costs accrued but unpaid.
- Revolving line of credit — short-term borrowing against receivables and inventory. Often the primary short-term liquidity tool for manufacturers.
- Current portion of long-term debt — equipment loan and term loan payments due within the next 12 months.
Long-term liabilities:
- Equipment loans (long-term portion) — principal due beyond 12 months on machinery and equipment financing.
- Finance leases on equipment — equipment leased under finance (capital) lease terms; treated as a purchased asset with a corresponding liability.
- Deferred tax liabilities — the cumulative timing difference between MACRS tax depreciation and straight-line book depreciation. This grows during periods of heavy equipment investment and shrinks as older assets become fully depreciated.
- Long-term operating lease liability — any factory or warehouse lease longer than 12 months, required on the balance sheet under ASC 842.
Equity
For most SMB manufacturers:
- Owner's equity / paid-in capital — the cumulative investment by the owner(s).
- Retained earnings — accumulated profits minus distributions. In a manufacturing operation with moderate net margins (typically 5–10%), retained earnings grow steadily with consistent profitability.
For incorporated manufacturers: common stock, additional paid-in capital, and retained earnings.
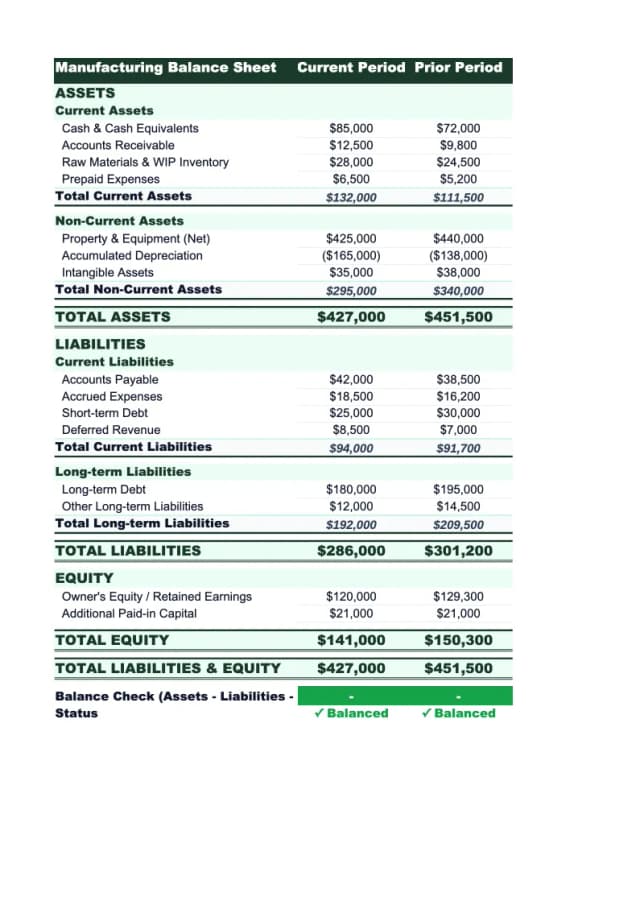
Complete Example: Mid-Size Job Shop Manufacturer
Here's a representative balance sheet for a privately held contract manufacturer doing approximately $4.5 million in annual revenue:
Assets
Current Assets
| Line Item | Amount |
|---|---|
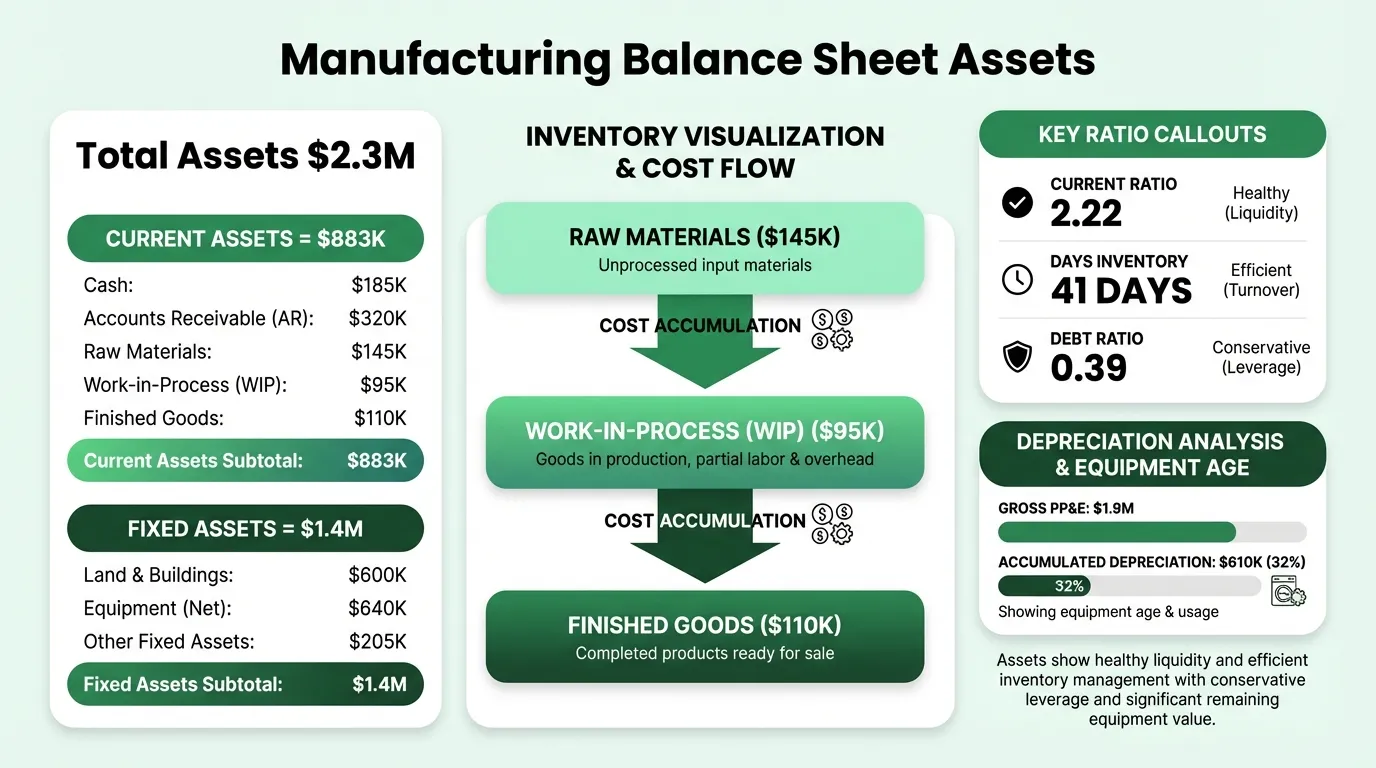
| Cash and cash equivalents | $185,000 |
| Accounts receivable, net | $320,000 |
| Raw materials inventory | $145,000 |
| Work-in-process inventory | $95,000 |
| Finished goods inventory | $110,000 |
| Prepaid expenses | $28,000 |
| Total Current Assets | $883,000 |
Long-Term Assets
| Line Item | Amount |
|---|---|
| Land | $120,000 |
| Plant and buildings | $480,000 |
| Production machinery and equipment | $1,250,000 |
| Tooling and dies | $95,000 |
| Vehicles | $65,000 |
| Less: accumulated depreciation | ($610,000) |
| Construction in progress | $45,000 |
| Total Long-Term Assets | $1,445,000 |
Total Assets: $2,328,000
Liabilities
Current Liabilities
| Line Item | Amount |
|---|---|
| Accounts payable | $145,000 |
| Accrued wages | $62,000 |
| Accrued manufacturing overhead | $18,000 |
| Revolving line of credit | $95,000 |
| Current portion of equipment loans | $78,000 |
| Total Current Liabilities | $398,000 |
Long-Term Liabilities
| Line Item | Amount |
|---|---|
| Equipment loans (long-term) | $415,000 |
| Deferred tax liabilities | $88,000 |
| Total Long-Term Liabilities | $503,000 |
Total Liabilities: $901,000
Equity
| Line Item | Amount |
|---|---|
| Owner's paid-in capital | $720,000 |
| Retained earnings | $707,000 |
| Total Equity | $1,427,000 |
Total Liabilities + Equity: $2,328,000
What the Numbers Actually Mean
Current Ratio
Current Ratio = Current Assets / Current Liabilities
In this example: $883,000 / $398,000 = 2.22
A current ratio between 1.5 and 3.0 is considered healthy for manufacturers. The industry median for U.S. manufacturers sits around 2.37 based on SEC filing data. This manufacturer is in a solid position. A ratio below 1.2 is a lender red flag — it means the business can't cover near-term obligations from near-term assets.
Unlike retailers, manufacturers need higher current ratios because inventory takes longer to convert to cash (raw materials → production cycle → finished goods → sale → collection), and production disruptions caused by liquidity shortfalls are expensive to recover from. Effective manufacturing inventory management shortens this conversion cycle and improves the ratio over time.
Quick Ratio
Quick Ratio = (Current Assets − Total Inventory) / Current Liabilities
In this example: ($883,000 − $350,000) / $398,000 = 1.34
The quick ratio strips out inventory — because inventory can't always be converted to cash quickly, especially WIP that can't be sold mid-cycle. A quick ratio above 1.0 means the business can cover current liabilities without relying on inventory liquidation. Manufacturers typically run lower quick ratios than their current ratios because inventory is such a large share of current assets; a range of 0.8–1.3 is common for healthy SMB manufacturers.
Debt Ratio
Debt Ratio = Total Liabilities / Total Assets
In this example: $901,000 / $2,328,000 = 0.39
The manufacturing industry median debt ratio is approximately 0.51. A ratio of 0.39 is conservative — this company has funded a larger share of its assets through equity than debt. Below 0.5 signals a financially conservative operation; above 0.65 begins to concern lenders.
Days Inventory Outstanding (DIO)
DIO = (Total Inventory / COGS) × 365
In this example, assuming COGS of $3.15M (70% of $4.5M revenue): ($350,000 / $3,150,000) × 365 = 41 days
This is strong. Competitive SMB manufacturers typically target 60–90 days of inventory. A 41-day figure suggests efficient procurement and tight production scheduling — less cash tied up in inventory at any given time. A rising DIO quarter over quarter is an early warning sign of either slowing demand or procurement problems.
Need a ready-made balance sheet template for your manufacturing?
Download a pre-built spreadsheet with industry-specific categories, formulas, and formatting.
The Three Inventory Lines Under a Microscope
Each inventory layer carries different management risks:
| Inventory Type | Risk | What a Rising Balance Signals |
|---|---|---|
| Raw materials | Supplier disruption; input cost changes | Over-purchasing; long lead times; price hedging |
| Work-in-process | Production stoppage costs; overhead absorption | Bottlenecks; machine downtime; scheduling problems |
| Finished goods | Demand softening; obsolescence | Sales slow-down; over-production; customer order deferrals |
A finished goods balance that grows faster than accounts receivable is the most immediate concern — it means you're producing more than you're selling. A raw materials balance that's shrinking while WIP stays flat could signal a supply chain problem that will slow production next month. Understanding how these inventory layers flow through to cost of goods manufactured connects the balance sheet numbers to your profitability picture.
Equipment and Depreciation: What the Balance Sheet Reveals
The net PP&E figure tells you something important: accumulated depreciation relative to gross PP&E shows how old your equipment base is.
In this example:
- Gross PP&E (excluding land and CIP): $1,890,000
- Accumulated depreciation: $610,000
- Net PP&E: $1,280,000
- Depreciation ratio: 32%
A depreciation ratio of 30–50% is typical for a manufacturer with a reasonably modern asset base. When accumulated depreciation climbs above 70–80% of gross PP&E, it signals aging equipment nearing end of useful life — which means significant capital expenditure is coming. Investors and acquirers scrutinize this closely because old equipment creates capex risk that doesn't show up in profitability metrics.
Book vs. tax depreciation. For financial statements, most manufacturers use straight-line depreciation — equal amounts each year over the asset's useful life. For tax returns, they use MACRS, which front-loads deductions in the early years. A $400,000 CNC machine depreciated on a 7-year MACRS schedule generates a $114,000 deduction in year two, versus $57,000 using straight-line. The tax savings arrive faster, but the IRS gets them back over time — which is why the deferred tax liability balance builds up during heavy investment years.
What Lenders Look At
When a manufacturer applies for an SBA loan, equipment financing, or a revolving credit line, lenders review the balance sheet alongside the income statement and cash flow projections.
| What They Check | What They Want to See |
|---|---|
| Current ratio | Above 1.2–1.5, stable or improving |
| Debt-to-equity ratio | Below 2.0; preferred range is 0.5–1.5 |
| Inventory composition | Finished goods not growing faster than AR |
| Net PP&E vs. gross PP&E | Equipment not too heavily depreciated (capex risk) |
| Deferred tax liability | Growing DTL accepted; it indicates recent investment |
| Accounts receivable aging | Minimal balances past 60 days |
| Revolving line utilization | Not maxed out; headroom available |
| Equity trend | Retained earnings growing year over year |
One ratio lenders pay particular attention to is Debt Service Coverage (DSCR) = Net Operating Income / Total Debt Service. Most banks require DSCR above 1.25 — meaning the business generates $1.25 for every $1.00 of debt payments. A DSCR below this threshold typically results in loan denial or reduced advance rates on inventory and receivables. Use our manufacturing break-even calculator to model how volume changes affect your ability to service debt.
Using the Balance Sheet Monthly
Manufacturing owners typically review their income statement monthly — revenue, COGS, gross margin. Fewer review the balance sheet on the same cadence, and that's where slow-moving problems hide.
Check these each month:
- Finished goods balance — growing while revenue is flat? You're over-producing.
- WIP balance — rising without a corresponding rise in raw materials? A production bottleneck may be building.
- Accounts payable relative to raw materials — if AP is growing faster than raw materials purchases, you're falling behind on supplier payments. That strains terms and relationships.
- Revolving line utilization — how much of your credit line is drawn? Consistent usage above 80% is a warning that working capital is stretched.
- Accumulated depreciation ratio — track it quarterly. A rapid increase signals you'll need a significant capex conversation soon. For guidance on how to structure the manufacturing accounting system that feeds these monthly reviews, start with the chart of accounts and costing method selection.
The Manufacturing Balance Sheet Template is structured for this monthly review, with the three-layer inventory breakdown and key ratio calculations built in.
For a complete financial picture, it pairs with the Manufacturing Income Statement Template — which covers revenue, COGS breakdown, and operating profitability — and the Manufacturing Budget Template, which lets you compare planned versus actual performance across the year.
The balance sheet shows what you own and owe. The income statement shows whether you're profitable. The cash flow statement shows whether you can cover your obligations. None of those questions answers the others, and in manufacturing, where inventory cycles and equipment cycles are long, the balance sheet is often the one that catches problems first.
Last updated: March 24, 2026
Frequently Asked Questions
Related Articles
Church Accounting Best Practices: A Practical Guide
How church accounting works — fund accounting, restricted funds, internal controls, financial reports, and the tax rules that catch churches off guard.
Church Balance Sheet Example: A Line-by-Line Breakdown
A complete church balance sheet example with real line items, fund accounting explained, and the benchmarks church boards use to assess financial health.
Construction Accounting: A Practical Guide for Contractors
Construction accounting is different from standard accounting. This guide covers job costing, WIP schedules, retainage, revenue recognition methods, and common mistakes.
Construction Balance Sheet Example: A Line-by-Line Breakdown
A complete construction company balance sheet example with real line items, WIP accounting, retainage, overbilling, and what sureties and lenders look for.
Daycare Balance Sheet Example: Line by Line
A complete daycare balance sheet example with real line items — enrollment deposits, playground equipment, subsidy receivables, and what the numbers mean.
Food Truck Balance Sheet Example: A Line-by-Line Breakdown
A complete food truck balance sheet example with real line items, truck depreciation rules, and what makes a food truck's financials different from a restaurant.