Manufacturing Income Statement Template
Report gross profit, operating income, and net margin for your manufacturing business with an income statement structured around direct materials, direct labor, and overhead — not generic expense buckets.
What's Inside This Manufacturing Income Statement Template
This template includes 5 worksheets, each designed for a specific part of your manufacturing financial workflow:
Monthly Income Statement
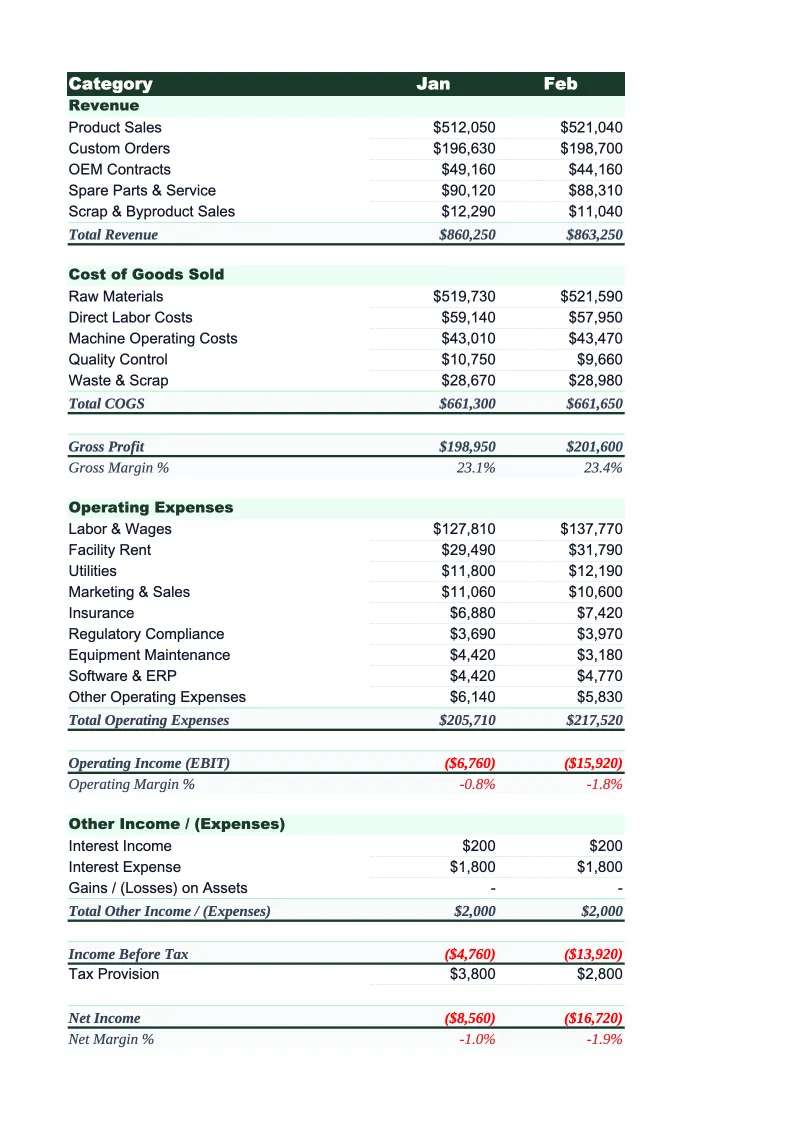
The core reporting worksheet structured in the standard manufacturing income statement format: net revenue at the top, followed by cost of goods sold broken out into direct materials, direct labor, and manufacturing overhead, then gross profit, operating expenses (SG&A, R&D, depreciation), operating income (EBIT), interest expense, and net income before and after tax.
Annual Summary
A 12-month rollup that aggregates each monthly statement into a full-year view.
Actual vs Prior Year
A comparison sheet that lets you track this year's performance against the prior year, line item by line item.
Product Line Breakdown
An optional worksheet for manufacturers selling multiple product lines or running multiple production cells.
KPI Dashboard
A one-page summary with the financial metrics that manufacturing operators and CFOs track month to month: gross margin percentage, operating margin, net margin, COGS as a percentage of revenue, SG&A as a percentage of revenue, and EBITDA.
Manufacturing Income Statement Template Features
- COGS broken into direct materials, direct labor, and manufacturing overhead
- Gross profit, EBIT, EBITDA, and net income auto-calculations
- 12-month annual rollup from monthly sheets
- Actual vs prior year comparison with dollar and percentage variance
- Product line gross margin breakdown
- Pre-loaded with standard manufacturing chart of accounts line items
How to Use This Manufacturing Income Statement Spreadsheet
Download the .xlsx file and open it in Excel or Google Sheets — no macros or plugins required. Start with the Monthly Income Statement sheet and review the pre-loaded line items. Most manufacturers will recognize the structure immediately: net revenue up top, COGS broken into direct materials, direct labor, and overhead, then the operating expense section below. Adjust any line item labels to match your chart of accounts — this takes less than 10 minutes for most operations. If you sell a single product line, you can skip the Product Line Breakdown sheet entirely.
Once the structure is set up, enter your current month's figures. If you're working from a trial balance, map your GL accounts to the pre-built line items — the categories are broad enough to accommodate most manufacturing accounting setups. The formulas calculate gross profit, operating income, and net income automatically as you fill in numbers. Work backward through prior months if you want to populate the Annual Summary and Actual vs Prior Year sheets from the start; otherwise, you can add historical data later.
15 minutes from download to your first income statement
Download the template, enter your numbers, and see your manufacturing operation's full financial picture — gross margin, operating income, and net income calculated automatically.
Why Every Manufacturer Needs a Proper Income Statement
Most manufacturers run tighter margins than their revenue suggests. Gross margins of 20–35% are common across contract manufacturing, job shops, and production facilities, but that spread hides enormous variation depending on product mix, material costs, and how efficiently overhead is absorbed. An income statement structured for manufacturing — with COGS split into direct materials, direct labor, and overhead as separate line items — makes it possible to diagnose where margin is being lost, rather than just knowing that it is. A generic income statement with a single COGS line tells you almost nothing useful.
The standard manufacturing income statement follows a format that cost accountants and lenders recognize: net revenue minus COGS equals gross profit, minus operating expenses (SG&A, R&D, depreciation) equals operating income, minus interest expense equals pre-tax income, minus taxes equals net income. Within COGS, direct materials typically represent 40–60% of revenue in most manufacturing segments, direct labor 10–20%, and overhead 10–15%. When material costs spike — as they did across most manufacturing segments in 2021–2023 — having those components visible as separate line items lets you model the impact of a 5% steel price increase or a labor rate change without rebuilding your entire P&L.
Manufacturing Industry at a Glance
Financial templates built for manufacturers — from job shops and contract fabricators to production facilities. Pre-loaded with cost categories, billing structures, and KPIs specific to how manufacturers track materials, labor, and overhead.
Revenue Drivers
- Product sales
- Contract/job shop work
- Tooling and setup fees
- NRE charges
- Material markups
- Aftermarket parts and service
Key Cost Categories
- Raw materials / direct materials
- Direct labor
- Manufacturing overhead
- Outside processing / subcontracting
- Equipment depreciation
- SG&A
Typical Margins
Gross: 20-35% · Net: 4-10%
Seasonality
Q1 weakest across most segments. Q3/Q4 strongest for consumer goods and construction materials manufacturers. Automotive suppliers follow OEM model-year shutdowns. Industrial equipment sees Q4 budget-spend surge.
Key Performance Indicators
Manufacturing Income Statement Template FAQ
More Manufacturing Templates
Manufacturing Balance Sheet Template for Excel
$29
Manufacturing Budget Template for Excel
$29
Manufacturing Business Plan Template for Excel
$39
Manufacturing Cash Flow Template for Excel
$29
Manufacturing Expense Tracker Template for Excel
$29
Manufacturing Financial Model Template for Excel
$29
Manufacturing Invoice Template for Excel
$29
Manufacturing KPI Dashboard Template for Excel
$29
Manufacturing P&L Template for Excel
$29
Manufacturing Pro Forma Template for Excel
$29
Manufacturing Project Budget Template for Excel
$29
Manufacturing Sales Forecast Template for Excel
$29
Manufacturing Business Valuation Template for Excel
$29
More Income Statement Templates
Accounting Firm Income Statement Template for Excel
$29
Auto Repair Income Statement Template for Excel
$29
Car Wash Income Statement Template for Excel
$29
Church Income Statement Template for Excel
$29
Cleaning Service Income Statement Template for Excel
$29
Coffee Shop Income Statement Template for Excel
$29
Manufacturing Income Statement Template
$29