Real Estate Balance Sheet Example: A Line-by-Line Breakdown
A complete real estate balance sheet example for rental property owners — covering assets, liabilities, equity, and the line items that make real estate unique.
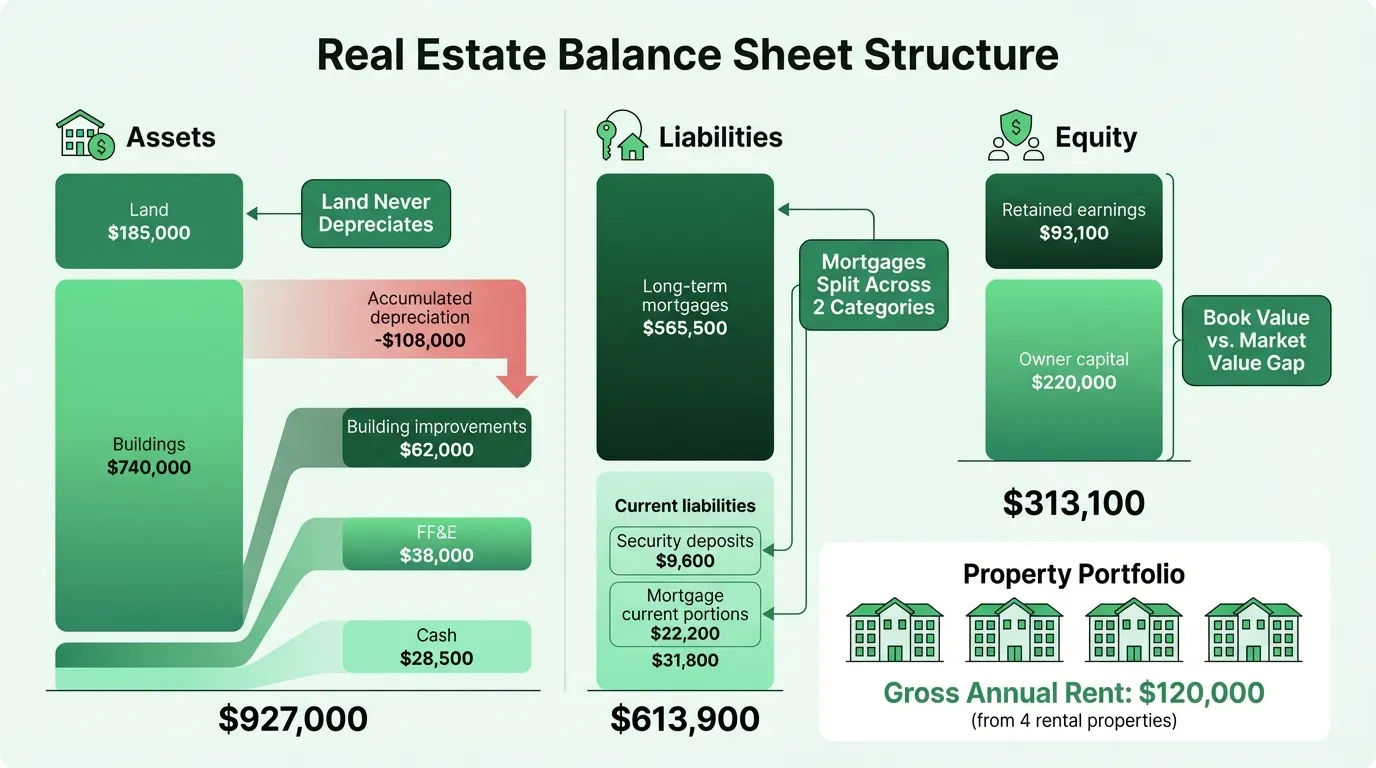
A real estate balance sheet is not just a generic business balance sheet with properties plugged in. The accounting treatment is different in ways that matter: land never depreciates, buildings do, mortgages split across two liability categories, and the book value of your portfolio will diverge from its market value every year. Understanding those differences helps you read your financials accurately — and explain them to lenders.
This post walks through a complete real estate investor balance sheet, line by line.
What Makes a Real Estate Balance Sheet Different
For most businesses, fixed assets are equipment, furniture, or technology — things that wear out quickly. For a real estate investor, fixed assets are the business. Land and buildings represent the majority of the asset base, and the accounting rules around them are specific:
Land is never depreciated. It has an indefinite useful life. This matters at purchase: when you buy a property, you must allocate the acquisition cost between land and building, because only the building depreciates. Common methods include using county assessor ratios or a formal appraisal.
Buildings depreciate over long schedules. Residential rental property: 27.5 years, straight-line. Commercial real estate: 39 years, straight-line. A building purchased for $275,000 depreciates at $10,000 per year for residential or $7,051 per year for commercial. Accumulated depreciation appears on the balance sheet as a contra-asset — deducted from the gross building cost to show net book value.
Book value and market value diverge. Properties are recorded at historical cost — what you paid, not what they're worth today. A property bought in 2015 for $400,000 that's now worth $700,000 still sits on your balance sheet at cost (minus accumulated depreciation). This means your equity on paper will typically be much lower than your actual equity in the market. That gap widens every year as properties appreciate and depreciation accumulates.
Mortgages split into two line items. The principal due in the next 12 months goes under current liabilities. The rest goes under long-term liabilities. You determine the current portion from your loan amortization schedule — the sum of principal payments over the next 12 months. Interest never appears on the balance sheet; it's expensed on the income statement as it accrues.
Security deposits are always liabilities. Money collected from tenants as a security deposit is never income when received. It sits on the balance sheet as a liability ("Security Deposits Held") until either returned to the tenant or legally forfeited. This confuses new real estate investors more than almost any other accounting concept.
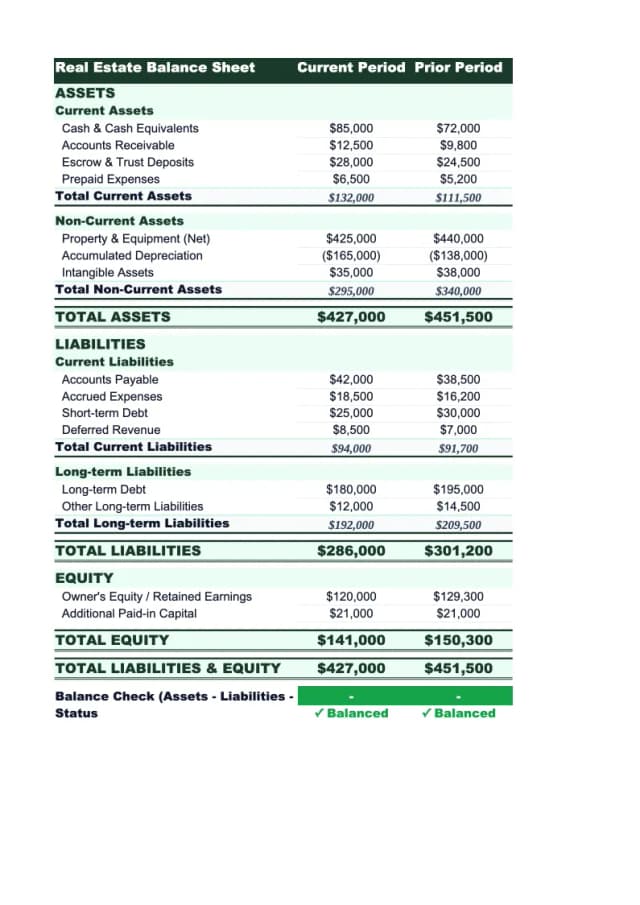
Complete Example: Residential Rental Portfolio
Here's a representative balance sheet for a real estate investor with four residential rental properties — three long-term rentals and one mid-term furnished rental — producing approximately $120,000 in annual gross rent:
Assets
Current Assets
| Line Item | Amount |
|---|---|
| Cash and cash equivalents (operating account) | $28,500 |
| Rent receivable (outstanding tenant payments) | $4,200 |
| Prepaid insurance | $3,800 |
| Prepaid property taxes | $6,100 |
| Total Current Assets | $42,600 |
Long-Term Assets
| Line Item | Amount |
|---|---|
| Land | $185,000 |
| Buildings | $740,000 |
| Less: accumulated depreciation | ($108,000) |
| Building improvements | $62,000 |
| Less: accumulated depreciation — improvements | ($14,400) |
| Furniture, fixtures, and equipment | $38,000 |
| Less: accumulated depreciation — FF&E | ($18,200) |
| Total Long-Term Assets | $884,400 |
Total Assets: $927,000
Liabilities
Current Liabilities
| Line Item | Amount |
|---|---|
| Accounts payable (contractor, vendor invoices) | $5,200 |
| Accrued property taxes | $8,400 |
| Security deposits held | $9,600 |
| Prepaid/unearned rent | $3,000 |
| Current portion of mortgage — Property 1 | $6,800 |
| Current portion of mortgage — Property 2 | $5,400 |
| Current portion of mortgage — Property 3 | $4,900 |
| Current portion of mortgage — Property 4 | $5,100 |
| Total Current Liabilities | $48,400 |
Long-Term Liabilities
| Line Item | Amount |
|---|---|
| Mortgage payable — Property 1 (long-term portion) | $168,000 |
| Mortgage payable — Property 2 (long-term portion) | $142,000 |
| Mortgage payable — Property 3 (long-term portion) | $124,500 |
| Mortgage payable — Property 4 (long-term portion) | $131,000 |
| Total Long-Term Liabilities | $565,500 |
Total Liabilities: $613,900
Equity
| Line Item | Amount |
|---|---|
| Owner's initial capital contributions | $220,000 |
| Retained earnings | $93,100 |
| Total Equity | $313,100 |
Total Liabilities + Equity: $927,000
Reading the Numbers: What They Actually Tell You
Book Equity vs. Market Equity
The balance sheet shows $313,100 in equity. But that's the book figure — assets recorded at historical cost minus accumulated depreciation.
Market equity is different. If these four properties have appreciated since purchase and are now worth $1,350,000 combined, while outstanding mortgage balances total $565,500 (long-term portion only, not counting the current portions already in current liabilities), then market equity is closer to $780,000 — more than twice the book figure.
Neither number is wrong. Book equity is what your accountant reports and what your tax return reflects. Market equity is what you'd walk away with after selling and paying off the loans. Long-held real estate portfolios typically have a significant and growing gap between the two.
Loan-to-Value Ratio
Lenders use LTV — not the balance sheet equity figure — to assess your borrowing capacity:
LTV = Outstanding Mortgage Balance / Current Market Value of Properties
For a portfolio with $590,000 in total mortgage debt (current + long-term) against $1,350,000 in current market value: LTV = 43.7%. That's a strong position. For stabilized residential rentals, most lenders target LTV of 70-75% for new financing. Being significantly below that threshold means you have equity to leverage for additional acquisitions.
Debt Service Coverage Ratio (DSCR)
DSCR is the metric lenders use to assess whether the properties generate enough cash to service the debt:
DSCR = Net Operating Income / Annual Debt Service
If this portfolio generates $120,000 gross rent, has $36,000 in operating expenses (vacancy, repairs, management, taxes), and net operating income is $84,000 — with annual debt payments of $57,600 — DSCR = 1.46x. Most residential lenders require a minimum of 1.20x-1.25x. A DSCR above 1.35x generally qualifies for the most competitive rates.
DSCR doesn't live on the balance sheet; it's calculated using the income statement alongside the balance sheet. But lenders will calculate it from your financials when you apply for refinancing or new acquisition loans. Use our real estate cash flow calculator to check whether your NOI comfortably covers debt service before approaching a lender.
Current Ratio
Current Ratio = Current Assets / Current Liabilities
In this example: $42,600 / $48,400 = 0.88
For a real estate investor, a current ratio slightly below 1.0 is common and not necessarily alarming — especially when most current liabilities are mortgage principal payments and security deposits (which are offset by the tenant relationship, not true cash obligations in the near term). A current ratio that's declining rapidly or falling below 0.5 warrants attention. The immediate liquidity concern is cash ($28,500) relative to near-term obligations: does it cover upcoming mortgage payments and maintenance without straining?
Need a ready-made balance sheet template for your real estate?
Download a pre-built spreadsheet with industry-specific categories, formulas, and formatting.
Real Estate-Specific Line Items Explained
Security Deposits Held
$9,600 in the example above represents deposits collected from tenants across four properties. This money is not yours — it belongs to the tenant until they vacate and you assess the property. In many states, you're legally required to hold it in a separate account, not commingled with operating funds.
When a tenant moves out and you return the deposit: debit Security Deposits Held, credit Cash. When a tenant forfeits all or part of a deposit for damages: debit Security Deposits Held, credit Rental Income for the forfeited amount.
A common error is recording the received deposit as rental income. That produces overstated income and understated liabilities until the tenant moves out.
Prepaid/Unearned Rent
When a tenant pays last month's rent at lease signing, or pays a month in advance, that amount is a liability — not revenue — until the applicable rental period arrives. In the example, $3,000 in prepaid rent from one tenant sits under current liabilities until the month it applies to.
Accumulated Depreciation
The $108,000 in accumulated depreciation on buildings represents roughly 11 years of depreciation at approximately $10,000/year on an average building value across the portfolio. As this number grows, net book value of the assets shrinks — even as market value may rise. This widening gap between gross cost and net book value is one reason why older real estate portfolios look highly leveraged on paper while holding substantial real economic equity.
Building Improvements vs. Repairs
One classification decision that affects the balance sheet: capital improvements are capitalized (added to the asset base), while repairs and maintenance are expensed. A new HVAC system ($8,000) is a capital improvement — it goes on the balance sheet and depreciates over its useful life. Fixing a broken HVAC component ($600) is a repair — it goes straight to the income statement in the period incurred.
The IRS has specific rules under the Tangible Property Regulations that govern this distinction. Getting it wrong means either overstating your asset base (by capitalizing repairs) or understating it (by expensing improvements). Consistent application matters for both financial reporting and tax return accuracy. The real estate accounting guide covers the BAR analysis framework for making this classification correctly.
What Lenders Look For
When you refinance a property or apply for acquisition financing, lenders review the balance sheet alongside the rental income history. Key items they focus on:
| What They Check | What They Want to See |
|---|---|
| LTV ratio | Typically 70–75% max for new residential financing |
| DSCR | 1.20x–1.25x minimum; 1.35x+ for best rates |
| Cash on hand | Enough to cover 2–6 months of debt service |
| Equity trend | Growing retained earnings; not being drained by distributions |
| Property depreciation schedules | Correct splits between land and building |
| Security deposits | Properly reflected as liabilities, not income |
| Mortgage current/long-term split | Accurate; matches amortization schedule |
A balance sheet with properties properly depreciated, mortgages correctly split, and security deposits appropriately categorized signals financial discipline. One where the accounting is sloppy — deposits treated as income, mortgages shown as a single undifferentiated figure, improvements mixed with repairs — raises questions about what else might be wrong.
Investor vs. Brokerage: A Key Distinction
This post covers the balance sheet for a property-owning investor. A real estate brokerage or agency looks completely different. A brokerage doesn't own the properties it sells — so there are no land or building assets, no mortgages, and no security deposits held. Instead, the brokerage's primary assets are cash and commissions receivable (pending closings), and the central unique liability is the trust account liability — client earnest money held in a legally-segregated trust account, which must appear as both an asset (the trust bank balance) and an equal, offsetting liability (funds owed to clients).
If you're running a brokerage rather than owning properties, that's a different financial structure entirely.
Building the Balance Sheet in Practice
For a small portfolio, a purpose-built spreadsheet is the right tool. You need to track:
- Each property's acquisition cost, land/building allocation, and depreciation schedule
- Outstanding mortgage balances by property, split into current and long-term components
- Security deposits by tenant
- Cash accounts and any receivables
The Real Estate Balance Sheet Template is structured for exactly this — with per-property depreciation tracking, mortgage amortization splits, and the liability classifications that matter for both accurate reporting and lender review.
For a complete financial picture alongside the balance sheet, the Real Estate Financial Model Template covers cash-on-cash return, cap rate analysis, and NOI projections — the income side that the balance sheet alone doesn't show.
Three documents answer three different questions: the balance sheet asks what you own and owe, the income statement asks whether the properties are profitable, and the cash flow statement asks whether rents are actually covering debt service and expenses. None of them tells the whole story alone.
Last updated: March 24, 2026
Frequently Asked Questions
Related Articles
Church Accounting Best Practices: A Practical Guide
How church accounting works — fund accounting, restricted funds, internal controls, financial reports, and the tax rules that catch churches off guard.
Church Balance Sheet Example: A Line-by-Line Breakdown
A complete church balance sheet example with real line items, fund accounting explained, and the benchmarks church boards use to assess financial health.
Construction Accounting: A Practical Guide for Contractors
Construction accounting is different from standard accounting. This guide covers job costing, WIP schedules, retainage, revenue recognition methods, and common mistakes.
Construction Balance Sheet Example: A Line-by-Line Breakdown
A complete construction company balance sheet example with real line items, WIP accounting, retainage, overbilling, and what sureties and lenders look for.
Daycare Balance Sheet Example: Line by Line
A complete daycare balance sheet example with real line items — enrollment deposits, playground equipment, subsidy receivables, and what the numbers mean.
Food Truck Balance Sheet Example: A Line-by-Line Breakdown
A complete food truck balance sheet example with real line items, truck depreciation rules, and what makes a food truck's financials different from a restaurant.