Restaurant Accounting Tips: What Actually Moves the Numbers
Practical restaurant accounting tips covering prime cost, chart of accounts, weekly reporting cadence, and the mistakes that quietly drain margins.
The restaurant industry doesn't have a thin margin problem. It has a margin discipline problem.
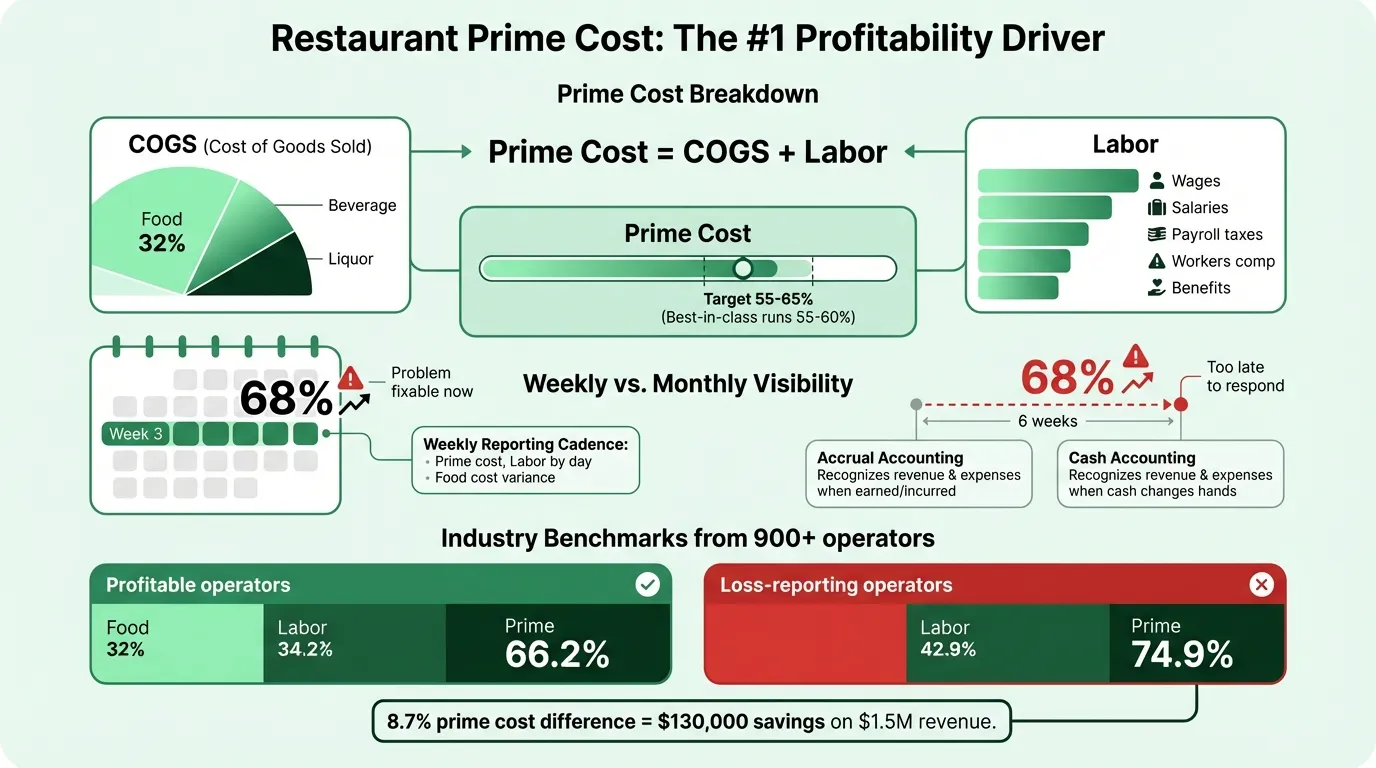
According to the National Restaurant Association's 2025 Operations Data Abstract — based on financial data from 900+ operators — profitable full-service restaurants kept labor costs at 34.2% of sales in 2024. Loss-reporting operators averaged 42.9%. That 8.7 percentage point gap, on a restaurant doing $1.5M in annual sales, is the difference between $130,000 in labor cost and $64,000. The food is the same, the space is the same. The accounting discipline isn't.
These tips focus on the accounting practices that directly affect your numbers — not the software, not the theory.
Track Prime Cost Every Week, Not Every Month
Prime cost is the one number that predicts restaurant profitability better than anything else:
Prime Cost = Cost of Goods Sold + Total Labor Costs
"Total labor costs" means everything: wages, salaries, payroll taxes, workers' comp, and benefits. Not just the hourly wage line on a paycheck.
The industry target is 55–65% of sales. Best-in-class operators run 55–60%. Above 65%, rent, utilities, marketing, and debt service consume whatever's left — and there usually isn't enough.
Most restaurant owners check prime cost monthly. By the time a monthly P&L surfaces the problem, you've already paid the costs. The operators who manage prime cost well check it weekly — every Friday or Monday, looking at last week's numbers. A week where prime cost runs at 68% is fixable. Six weeks of 68% before you notice it is a margin hole that's hard to dig out of.
The Restaurant P&L Template includes a weekly prime cost tracker alongside the standard monthly P&L format, so you can run both without double-entering your numbers.
Set Up Your Chart of Accounts for Restaurant Reporting
Most problems with restaurant financial reporting trace back to a chart of accounts that doesn't match how the industry measures performance. A few structural choices matter:
Break out COGS by subcategory. A single "food cost" line won't tell you where cost overruns are happening. Separate accounts for food (meat, seafood, produce, dairy, dry goods), beer/wine/liquor, non-alcoholic beverages, and paper/packaging let you see exactly where the variance is. If your seafood cost spikes in week 3, you want that visible — not buried in a blended food cost number.
Separate revenue by type. Dine-in food, dine-in beverages, alcohol, takeout, delivery, and catering should all be distinct revenue lines. This makes your P&L comparable across periods and makes it possible to see which revenue channels are growing or shrinking.
Use a 4-digit account numbering system. Assets in the 1000s, liabilities in the 2000s, equity in the 3000s, revenue in the 4000s, COGS in the 5000s, operating expenses in the 6000s. This is the standard restaurant chart of accounts structure and it's what any restaurant-experienced bookkeeper or accountant will expect.
Track gift card liability separately. Sold but unredeemed gift cards are a current liability, not revenue. This detail often gets lost in general setups. For more on how gift cards appear on your financials, see the Restaurant Balance Sheet Example.
Use 4-Week Accounting Periods Instead of Calendar Months
This is a best practice that most restaurant accountants use but many operators never hear about.
Calendar months have different numbers of days — and more importantly, different numbers of each day of the week. January has 31 days, February has 28. One January might have 5 Fridays; another has 4. Since restaurant revenue is heavily day-of-week dependent (Friday and Saturday typically account for 30–35% of weekly sales), comparing a 4-Friday month to a 5-Friday month produces meaningless variance.
The fix is 13 accounting periods of exactly 4 weeks each (52 weeks ÷ 4 = 13 periods). Every period contains exactly the same number of Mondays, Tuesdays, Fridays, and Saturdays. Comparisons are apples to apples.
If your accounting software supports custom fiscal periods, set this up from the beginning. If you're using calendar months, at minimum adjust your reporting to call out weeks with a 5th occurrence of a weekend day.
Reconcile Daily, Not Monthly
Daily reconciliation catches problems when they're small. The process takes 10–15 minutes:
- Export your POS daily sales report
- Check that credit card settlements deposited match POS credit card totals (typically 1–3 day lag)
- Check that cash deposits match POS cash totals
- Flag any discrepancies and investigate before the next day
Most accounting problems — voids that weren't legitimate, comps that bypassed the approval workflow, cash handling errors — are easy to identify close to when they occurred. After 30 days, the receipts are cold, the staff has changed, and you're reconstructing instead of reconciling.
Monthly reconciliation is necessary for a clean balance sheet and tax reporting. But it's the daily reconciliation habit that prevents the problems that make monthly reconciliation painful.
Need a ready-made p&l template for your restaurant?
Download a pre-built spreadsheet with industry-specific categories, formulas, and formatting.
Accrual Accounting vs. Cash — Which One Applies to You
Cash-basis accounting records income when cash is received and expenses when cash is paid. It's simpler to maintain and adequate for very small operations.
Accrual accounting records income when it's earned and expenses when they're incurred — regardless of cash timing. A food delivery received on December 30 but not paid until January 5 hits December's books under accrual, January's under cash.
For any restaurant beyond the startup stage, accrual accounting gives you a more accurate picture. It matches your costs to the revenue they helped generate. It's also what banks, SBA lenders, and potential buyers expect to see.
The IRS requires accrual accounting above $30M in average annual gross receipts. But operationally, it becomes valuable well before that threshold — typically once you're tracking inventory, running catering programs, or managing multiple revenue streams.
If you're currently on cash basis and want to switch, consult with a restaurant-experienced CPA. The transition involves adjusting how accounts payable, inventory, and prepaid expenses are handled. To understand how these items appear on your financials, the restaurant cash flow example walks through a full monthly and weekly statement.
The Weekly Reporting Cadence That Most Operators Skip
Three reports that should run every week, not just at month-end:
Prime cost report. COGS + labor as a percentage of sales for the week. Compare to your target and to the same week last year if you have the data.
Labor cost by day. Not just for the week as a whole — by day. A Wednesday where labor runs at 48% of sales is a scheduling problem with a clear date attached. Aggregated to the week, it becomes harder to address.
Food cost variance. Actual food cost versus theoretical food cost (what your recipes say you should have used). Any variance above 2–3% needs an explanation: over-portioning, waste, vendor invoicing errors, or inventory shrinkage. For a deeper look at how to run this analysis, see the restaurant inventory management best practices guide.
These reports take 20–30 minutes to run once your data is organized. The operators who skip them are the ones who discover margin problems at month-end when it's too late to do anything about the prior four weeks.
The Mistakes That Quietly Drain Restaurant Margins
Not physically counting inventory. Your COGS formula is: Beginning Inventory + Purchases − Ending Inventory. If you're estimating ending inventory rather than counting it, your food cost percentages are guesses. Physical counts once a week (for high-cost items like seafood, proteins, and liquor) and full counts at least twice a month are the standard for operators who want accurate food cost data.
Mixing personal and business finances. A business debit card used for a personal grocery run, owner reimbursements handled informally, personal expenses run through the business account — all of these make it impossible to generate clean financials. Use separate accounts from day one and pay yourself a formal salary or distribution.
Hiring a generalist accountant. Restaurant accounting involves tip reporting, inventory accounting, COGS subcategorization, gift card liability, and industry-specific benchmarks that generalist accountants don't work with regularly. An accountant who specializes in restaurants will structure your books differently from the start — and will catch issues that a generalist won't recognize as unusual.
Ignoring accounts payable aging. It's easy to let vendor invoices accumulate during a busy period. A growing accounts payable balance is one of the early signals that cash flow is tightening — it usually shows up on the balance sheet before it's visible on the P&L. Monthly review of the Restaurant Balance Sheet Template includes A/P as a specific line to track.
Not accounting for tips correctly. The IRS requires systematic tip tracking and reporting. Large food and beverage establishments with 10 or more employees have specific reporting requirements under IRS Form 8027. Tip mishandling creates legal exposure that can compound over years.
What Benchmarks Actually Tell You
From the National Restaurant Association's 2025 Restaurant Operations Data Abstract (2024 financial data, 900+ operators):
| Metric | Full-Service Median | Quick-Service Median |
|---|---|---|
| Food cost % | 32.0% of sales | 32.4% of sales |
| Labor cost % | 36.5% of sales | 31.7% of sales |
| Prime cost % | ~68% (combined) | ~64% (combined) |
Profitable full-service operators show a notably different labor cost profile — 34.2% versus 42.9% for loss-reporting operators. That's the benchmark worth watching against your own numbers.
Net profit margins in the industry average 2–4% for full-service and 4–9% for quick-service and fast casual. Top-performing restaurants across categories approach 10%. You can use the restaurant profit margin calculator to benchmark your own margins against these figures.
These numbers are useful as context, but your benchmark is your own historical performance trending in the right direction. A restaurant that's moved from 68% prime cost to 63% prime cost over 12 months is doing something right — regardless of where the industry median sits.
Building the Foundation
The financial infrastructure for a well-run restaurant is three documents: the P&L (profitability week to week and period to period), the balance sheet (what you own and owe), and the cash flow statement (when money actually moves through the account). None of them answers the others.
The Restaurant P&L Template is structured with the COGS subcategories, labor line items, and prime cost calculation that restaurant accounting requires. If you're rebuilding your P&L from scratch or your current setup doesn't support weekly prime cost reporting, it's the fastest way to get to a format that actually works.
Last updated: March 24, 2026
Frequently Asked Questions
Related Articles
Church Accounting Best Practices: A Practical Guide
How church accounting works — fund accounting, restricted funds, internal controls, financial reports, and the tax rules that catch churches off guard.
Church Balance Sheet Example: A Line-by-Line Breakdown
A complete church balance sheet example with real line items, fund accounting explained, and the benchmarks church boards use to assess financial health.
Construction Accounting: A Practical Guide for Contractors
Construction accounting is different from standard accounting. This guide covers job costing, WIP schedules, retainage, revenue recognition methods, and common mistakes.
Construction Balance Sheet Example: A Line-by-Line Breakdown
A complete construction company balance sheet example with real line items, WIP accounting, retainage, overbilling, and what sureties and lenders look for.
Daycare Balance Sheet Example: Line by Line
A complete daycare balance sheet example with real line items — enrollment deposits, playground equipment, subsidy receivables, and what the numbers mean.
Food Truck Balance Sheet Example: A Line-by-Line Breakdown
A complete food truck balance sheet example with real line items, truck depreciation rules, and what makes a food truck's financials different from a restaurant.