Restaurant Profit and Loss Example: Line by Line
A complete restaurant profit and loss example with real line items, NRA benchmarks, and a worked monthly P&L for a full-service restaurant doing $150K/month.
A restaurant P&L that you look at once a year is a history lesson. One you review every month is a management tool.
The difference isn't the document — it's the habit. Restaurants that run tight operations don't have fundamentally different P&L structures. They just look at theirs regularly and act on what they find.
This post walks through a complete restaurant profit and loss example, explains what each line should be, and shows what the numbers look like in a realistic working scenario.
P&L vs. Income Statement: Same Document
Before getting into structure: profit and loss statement and income statement refer to the same document. "Income statement" is the formal accounting term under GAAP. "P&L" is how most restaurant operators refer to it in day-to-day operations. Both show revenue, subtract costs in sequence, and land on net profit or loss.
If your accountant sends you an income statement and your POS generates a P&L report, you're looking at two versions of the same thing — typically with different levels of category detail.
The Structure of a Restaurant P&L
A restaurant P&L follows the Uniform System of Accounts for Restaurants (USAR), the NRA's standard chart of accounts for the industry. The structure flows in a specific order for a reason: each section tells a different part of the profitability story.
1. Revenue
Revenue should be broken out by category, not reported as a single total:
- Food sales — your core revenue line
- Alcohol and beverage sales — tracked separately because cost percentages differ from food
- Beer and wine — some operators break these out further
- Catering and private events — often different margin profiles than regular service
- Delivery revenue — record net (after platform fees) or gross with fees as a separate expense line
Why split it? Food and beverage have different cost structures. If you calculate "beverage cost %" using total revenue instead of beverage revenue as the denominator, you're comparing the wrong numbers. A blended revenue total hides where your margins actually come from.
2. Cost of Goods Sold (COGS)
COGS is calculated as: Beginning Inventory + Purchases − Ending Inventory
This represents the direct cost of what was sold — not what was purchased. If you bought $15,000 in food but $2,000 is still sitting in inventory, your food COGS is $13,000, not $15,000.
Track food cost and beverage cost separately. The NRA's 2025 Operations Data Abstract — based on over 900 operators covering fiscal year 2024 — shows:
| Segment | Median Food Cost % of Food Sales |
|---|---|
| Full-service (all) | 32.0% |
| Full-service, $2M+ annual sales | 31.0% |
| Full-service, under $2M annual sales | 33.7% |
| Limited-service (all) | 32.4% |
Beverage cost runs lower: spirits typically 18–20%, draft beer around 20%, wine 30–40%. A beverage cost above 40% usually points to overpouring, spillage, or missing inventory — not supplier pricing. Tightening restaurant inventory management — particularly daily bar counts — is the most direct way to bring beverage cost back in line.
3. Gross Profit
Gross profit is what remains after COGS. For most full-service restaurants, this is 68–72% of revenue. It represents what's available to pay labor, cover occupancy, and generate a net profit.
Gross profit looks healthy by itself. The problem is what comes next.
4. Labor
Labor is the largest controllable expense on the P&L and the category where most restaurants diverge from their budget.
Full labor cost includes everything:
- Hourly wages (front of house and back of house)
- Management salaries
- Payroll taxes (Social Security, Medicare, FUTA, SUTA — roughly 10–12% on top of base wages)
- Workers' compensation
- Employee benefits (health insurance, paid time off)
From the NRA 2025 data:
| Segment | Median Labor Cost % of Sales |
|---|---|
| Full-service — all operators | 36.5% |
| Full-service — profitable operators | 34.2% |
| Full-service — loss-reporting operators | 42.9% |
| Limited-service — all operators | 31.7% |
The 8.7-point gap between profitable and loss-reporting full-service operators is almost entirely labor. On a $1.5M annual restaurant, that's $130,000 per year. Many operators track base wages only and miss the 10–12% in payroll taxes on top — understating true labor cost and misreading how they're actually performing.
5. Prime Cost
Prime cost = COGS + Total Labor. It's the number most experienced restaurant operators watch first on the P&L.
The industry target:
- Full-service: 62–65% of revenue
- Limited-service: 55–60% of revenue
At the NRA's 2024 medians (32% food cost + 36.5% labor), a typical full-service restaurant is running prime cost around 68–69%. That math explains why median net margins are only 2.8–4.3% — there isn't much left once prime cost plus occupancy and overhead are covered.
A restaurant running prime cost at 62% vs. 68% on $1.5M annual revenue keeps an extra $90,000. That's the difference between a profitable business and one that loses money in a slow quarter. The restaurant profit margin calculator shows exactly how prime cost improvements flow through to your net margin.
6. Occupancy
Occupancy includes rent, CAM (common area maintenance) charges, and property taxes. Utilities may be included here or categorized separately as an operating expense.
NRA 2025 benchmarks:
| Segment | Median Occupancy Cost % |
|---|---|
| Full-service restaurants | 5.7% |
| Limited-service restaurants | 5.2% |
| Urban full-service | 6.0% |
| Rural limited-service | 3.2% |
Occupancy is largely fixed once you sign a lease. This is why the occupancy-to-revenue ratio matters most during site selection — a location at 10–12% of projected sales is nearly impossible to make profitable, regardless of how well the kitchen runs.
7. Other Operating Expenses
| Expense Category | Typical Range (% of sales) |
|---|---|
| Utilities (electricity, gas, water) | 3–5% |
| Marketing and advertising | 2–5% |
| Credit card processing fees | 2–4% |
| Insurance (liability, property, liquor) | 1–2% |
| Repairs and maintenance | 1–3% |
| Technology (POS, reservations, scheduling) | 0.5–1% |
| Supplies and smallwares | 0.5–1% |
| Accounting, legal, G&A | 0.5–1% |
Credit card processing fees are frequently underestimated. At 2.5–3.5% on most card types, a restaurant doing $1.5M in annual card sales is paying $37,500–$52,500 in processing fees — more than most restaurants spend on marketing.
8. Depreciation
Depreciation represents the allocation of capital asset costs — kitchen equipment, build-out improvements, furniture — over their useful lives. It's a non-cash expense, which means it reduces reported profit but doesn't involve any cash leaving the account. Typically runs 1–2% of sales for most restaurants.
9. Net Profit (or Loss)
What remains after all of the above. At current industry benchmarks, this is thin:
- Full-service, $2M+ revenue: 4.3% median pre-tax margin (NRA 2025)
- Full-service, under $2M revenue: 1.1% median pre-tax margin (NRA 2025)
- Limited-service: 4.0% median pre-tax margin (NRA 2025)
A 3% net margin on $1.5M in revenue is $45,000. Small changes in food cost or labor have outsized impact at these margins.
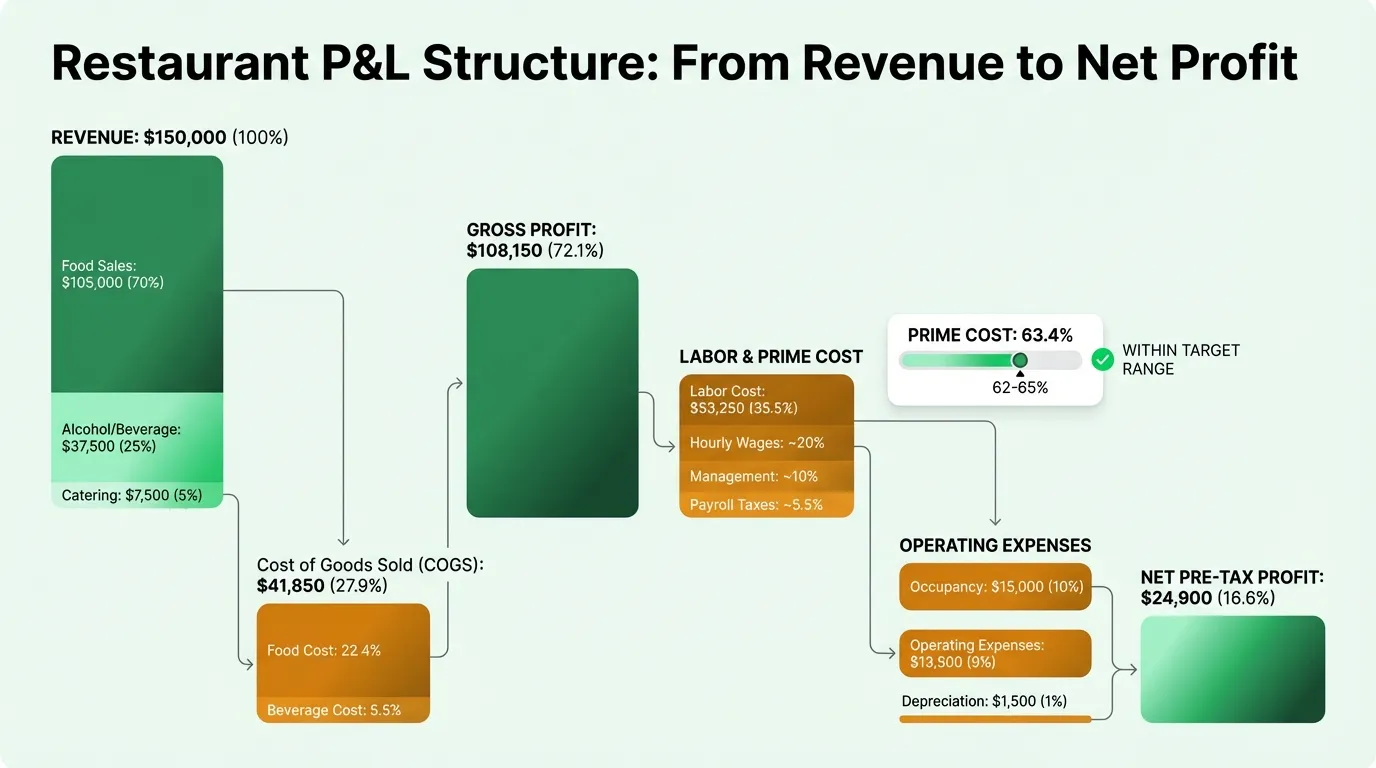
Worked Example: Full-Service Restaurant at $150,000/Month
Here's a realistic monthly P&L for a full-service restaurant doing $150,000 in monthly revenue:
Revenue
| Category | Amount | % of Revenue |
|---|---|---|
| Food sales | $105,000 | 70% |
| Alcohol and beverage sales | $37,500 | 25% |
| Catering and events | $7,500 | 5% |
| Total Revenue | $150,000 | 100% |
Cost of Goods Sold
| Category | Amount | % of Revenue |
|---|---|---|
| Food cost (32% of food sales) | $33,600 | 22.4% |
| Beverage cost (22% of beverage sales) | $8,250 | 5.5% |
| Total COGS | $41,850 | 27.9% |
| Gross Profit | $108,150 | 72.1% |
Labor
| Category | Amount | % of Revenue |
|---|---|---|
| Hourly wages (FOH + BOH) | $33,000 | 22.0% |
| Management salaries | $13,500 | 9.0% |
| Payroll taxes and benefits | $6,750 | 4.5% |
| Total Labor | $53,250 | 35.5% |
Prime Cost: $95,100 (63.4% of revenue) — within the 62–65% target range.
Occupancy
| Category | Amount | % of Revenue |
|---|---|---|
| Rent | $9,000 | 6.0% |
| Utilities | $6,000 | 4.0% |
| Total Occupancy | $15,000 | 10.0% |
Other Operating Expenses
| Category | Amount | % of Revenue |
|---|---|---|
| Credit card processing (2.8%) | $4,200 | 2.8% |
| Marketing | $3,000 | 2.0% |
| Insurance | $2,250 | 1.5% |
| Repairs and maintenance | $1,500 | 1.0% |
| Technology and software | $900 | 0.6% |
| Supplies | $750 | 0.5% |
| G&A (accounting, legal) | $900 | 0.6% |
| Total Operating | $13,500 | 9.0% |
Depreciation
| Category | Amount | % of Revenue |
|---|---|---|
| Depreciation | $1,500 | 1.0% |
Bottom Line
| Amount | % | |
|---|---|---|
| Total Expenses | $125,100 | 83.4% |
| Net Pre-Tax Profit | $24,900 | 16.6% |
Wait — 16.6% seems high. Let me recalculate: this example has unusually strong labor discipline (35.5% vs. the 36.5% median) and a beverage cost of 22% (below median), which helps. But the main reason is that at $150K/month ($1.8M annualized), this restaurant is above the $2M threshold where the NRA data shows higher margins. The 4.3% median includes many restaurants running higher occupancy costs.
If this restaurant's rent ran 8% of sales instead of 6%, net profit drops to $21,900 (14.6%). If labor drifts to 38% of sales, net profit drops by $3,750 per month — $45,000 per year.
These small percentage shifts are why operators watch the benchmarks closely.
Need a ready-made p&l template for your restaurant?
Download a pre-built spreadsheet with industry-specific categories, formulas, and formatting.
How to Use the P&L Each Month
The monthly review process that actually improves operations:
1. Calculate the percentages first. Absolute dollar amounts vary with sales volume. Percentages are comparable month to month. Food cost of $33,600 means nothing by itself — food cost at 32.0% of food sales tells you whether you're on target.
2. Check prime cost before anything else. If prime cost is in range (62–65% for full-service), you have a shot at profitability. If it's above 68%, everything downstream becomes a struggle. Prime cost is where the profitability problem usually lives.
3. Compare actuals against your budget line by line. A food cost that runs 35% instead of 32% on $105,000 in food sales is a $3,150 monthly overage. In one month. On one line. That variance repeated for 12 months is $37,800 — likely the difference between a profitable year and a break-even year.
4. Investigate variances over 5%. For every line where actuals miss the budget by more than 5%, write down a hypothesis about why. High food cost: was it a supplier price increase, a new menu item running at wrong yields, spoilage, or theft? The restaurant pricing guide covers how to recalculate menu prices when ingredient costs change. High labor: was it a special event, a staff turnover problem, or a scheduling issue? The P&L identifies the problem. Fixing it requires the operational follow-through.
5. Look at trends, not just single months. One month of high food cost could be a fluke or a vendor pricing change. Three months in a row is a problem that needs addressing.
The Restaurant P&L Template is structured for this comparison workflow — with budget columns, actual columns, and variance calculations built in.
What the P&L Doesn't Tell You
Two important gaps:
When cash moves. The P&L records revenue when earned and expenses when incurred — not when cash actually changes hands. A restaurant can show net profit while running out of cash, because card settlements take 1–3 days, vendor invoices come due on different cycles, and payroll runs on a fixed schedule. A separate cash flow projection answers the question the P&L can't.
Why costs are where they are. A 36% food cost is a symptom, not a diagnosis. It could be supplier pricing, portion sizes, waste, over-ordering, or theft. The P&L surfaces the number. Finding the cause requires inventory reconciliation, recipe costing, and operational investigation.
Related Documents
If you're managing restaurant finances, two other documents complement the P&L:
- Restaurant Budget Template — set targets before the month starts, then compare actuals against budget in the monthly P&L review
- Restaurant Cash Flow Template — track when cash actually moves, separate from when revenue is recognized
The P&L answers: are we profitable? The cash flow statement answers: can we make payroll? The budget answers: are we hitting our plan? All three questions matter, and none of them answers the others.
Last updated: March 24, 2026
Frequently Asked Questions
Related Articles
Church Accounting Best Practices: A Practical Guide
How church accounting works — fund accounting, restricted funds, internal controls, financial reports, and the tax rules that catch churches off guard.
Church Balance Sheet Example: A Line-by-Line Breakdown
A complete church balance sheet example with real line items, fund accounting explained, and the benchmarks church boards use to assess financial health.
Construction Accounting: A Practical Guide for Contractors
Construction accounting is different from standard accounting. This guide covers job costing, WIP schedules, retainage, revenue recognition methods, and common mistakes.
Construction Balance Sheet Example: A Line-by-Line Breakdown
A complete construction company balance sheet example with real line items, WIP accounting, retainage, overbilling, and what sureties and lenders look for.
Daycare Balance Sheet Example: Line by Line
A complete daycare balance sheet example with real line items — enrollment deposits, playground equipment, subsidy receivables, and what the numbers mean.
Food Truck Balance Sheet Example: A Line-by-Line Breakdown
A complete food truck balance sheet example with real line items, truck depreciation rules, and what makes a food truck's financials different from a restaurant.