Car Wash P&L Template
Track your car wash's revenue by service type, monitor chemical and labor costs, and see your real net margin with a P&L built specifically for car wash operators.
What's Inside This Car Wash P&L Template
This template includes 4 worksheets, each designed for a specific part of your car wash financial workflow:
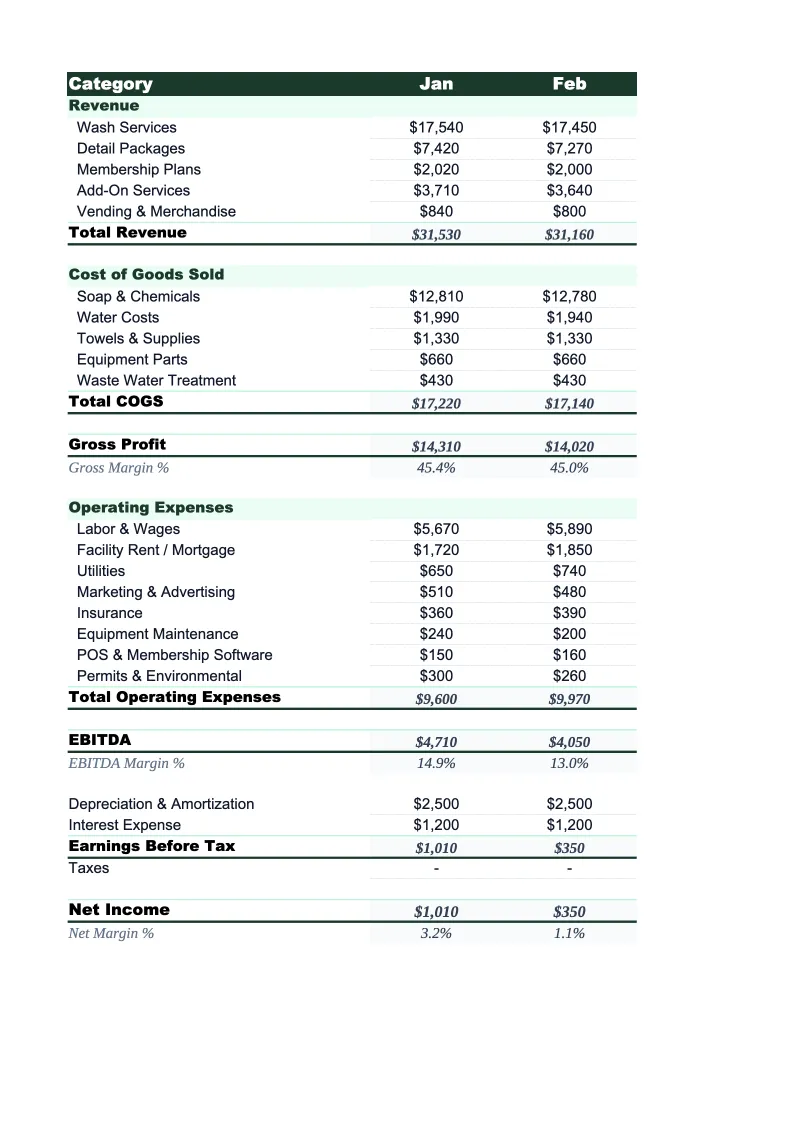
Monthly P&L
The core worksheet where you record each month's revenue and expenses.
Annual Summary
A 12-month view that pulls from each monthly sheet automatically.
Service Mix Analysis
A dedicated sheet for analyzing revenue by wash type and service category.
Dashboard
A visual summary with pre-built charts and KPI tiles covering the metrics that matter most to car wash operations.
Car Wash P&L Template Features
- Revenue split by wash package tier, memberships, fleet accounts, and detailing
- Chemical and supply costs tracked separately from labor and utilities
- Service mix analysis with per-category revenue and blended average ticket
- Monthly and annual P&L with gross margin and net income calculations
- Cost per car and revenue per bay KPI calculations
- Dashboard with charts for chemical cost %, labor %, and monthly net income
How to Use This Car Wash P&L Spreadsheet
Start by downloading the .xlsx file and opening it in Excel or Google Sheets — no macros, plugins, or account required. Open the Monthly P&L sheet and review the pre-loaded revenue and expense categories. Most car wash operators keep the structure as-is and adjust only the specific line items that don't apply to their format — for example, a self-serve location would remove the labor line for wash attendants, while a full-service tunnel would add a tipping or gratuity line. The whole setup takes under 15 minutes.
Enter your current month's revenue by source: retail wash sales by package tier, membership revenue, fleet billing, and any detailing or add-on income. Then fill in expenses using your chemical supplier invoices, payroll records, and utility bills. The Service Mix Analysis sheet is worth filling out in parallel — enter your car count by package type and the sheet calculates your average ticket and revenue per service automatically. These two numbers tell you far more than total revenue alone.
15 minutes from download to your first P&L
Download the template, plug in your numbers, and see your car wash's full financial picture — monthly P&L, service mix analysis, and annual summary included.
Why Every Car Wash Needs a P&L Template
Car wash P&L management is more complex than it looks. The business has high gross margins — chemicals and direct costs typically run 15–25% of revenue — but net margins vary wildly depending on equipment debt, rent, and whether you're running a self-serve, in-bay automatic, or full-service tunnel. An operator with strong gross margins can still struggle with a 5% net if equipment maintenance costs are high and membership pricing was set too low. Without a structured P&L, these problems are invisible until they've been dragging on for months.
The categories that matter most in a car wash P&L are the ones that move fastest. Chemicals and supplies fluctuate with volume and vendor pricing — knowing your chemical cost per car lets you renegotiate supplier contracts or adjust wash pricing before margins compress. Labor costs depend heavily on your wash format: a full-service tunnel may run 25–35% of revenue in labor while an in-bay automatic runs closer to 8–12%. Membership revenue, once you've built a base, carries near-zero variable cost — tracking it separately from retail washes shows you the true leverage in your business model.
Car Wash Industry at a Glance
Financial templates built for car wash businesses — from self-service bays and in-bay automatics to full-service tunnels and mobile detailing operations.
Revenue Drivers
- Retail wash sales
- Membership/subscription plans
- Fleet account billing
- Detailing & add-on services
Key Cost Categories
- Labor
- Chemicals & supplies
- Water & utilities
- Equipment maintenance & repairs
- Rent & occupancy
- Credit card processing fees
Typical Margins
Gross: 75-85% · Net: 15-45%
Seasonality
Spring and fall typically peak — customers wash after winter salt and before summer heat; slowest in deep winter in cold climates and during rainy stretches.
Key Performance Indicators
Car Wash P&L Template FAQ
More Car Wash Templates
Car Wash Balance Sheet Template for Excel
$29
Car Wash Budget Template for Excel
$29
Car Wash Business Plan Template for Excel
$39
Car Wash Cash Flow Template for Excel
$29
Car Wash Expense Tracker Template for Excel
$29
Car Wash Financial Model Template for Excel
$29
Car Wash Income Statement Template for Excel
$29
Car Wash Invoice Template for Excel
$29
Car Wash KPI Dashboard Template for Excel
$29
Car Wash Pro Forma Template for Excel
$29
Car Wash Project Budget Template for Excel
$29
Car Wash Sales Forecast Template for Excel
$29
Car Wash Valuation Template for Excel
$29
Car Wash P&L Template
$29