Construction P&L Template
See your construction company's revenue, direct job costs, subcontractor expenses, and net profit with a P&L built around how contractors actually track their financials.
What's Inside This Construction P&L Template
This template includes 4 worksheets, each designed for a specific part of your construction financial workflow:
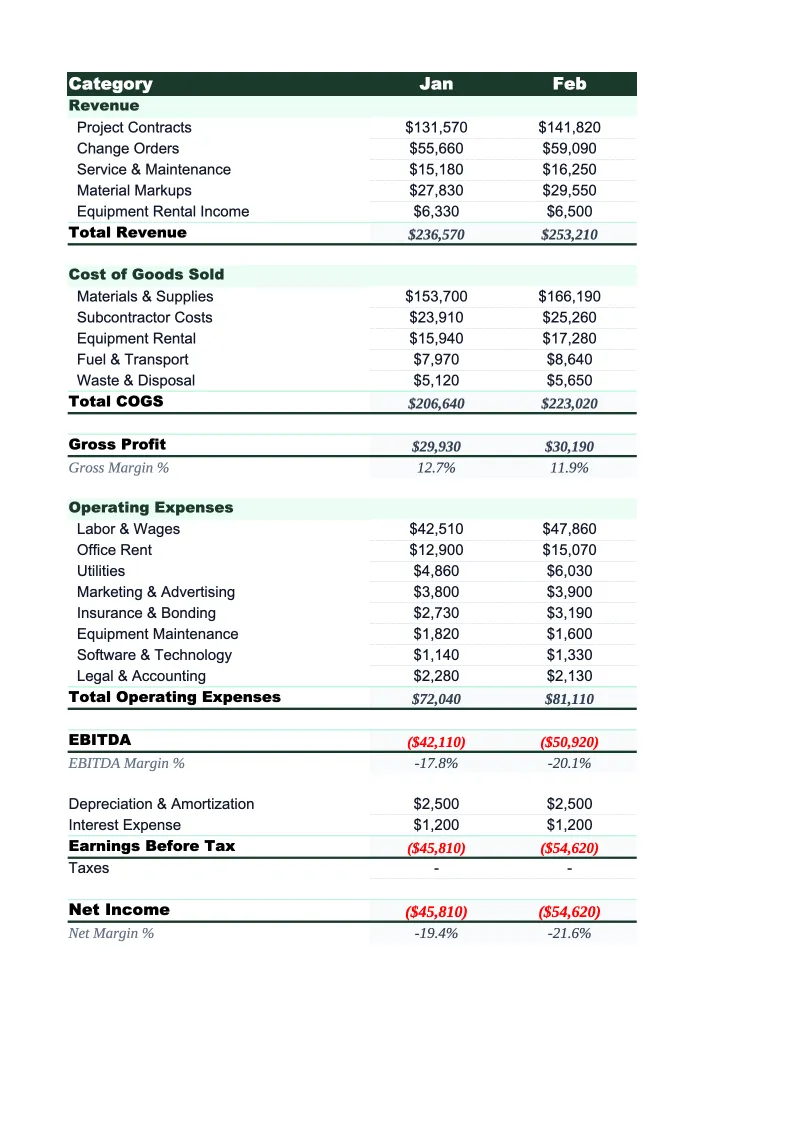
Monthly P&L
The core worksheet where you record each month's revenue and direct costs.
Annual P&L
A 12-month view that pulls from the Monthly P&L sheet automatically.
Job Cost Summary
A project-level breakdown that lets you enter job revenue and direct costs for each active project.
Dashboard
A one-page summary with pre-built charts and key financial metrics.
Construction P&L Template Features
- Revenue split by contract type: fixed-price, cost-plus, change orders, and service work
- Direct costs broken out by materials, labor, subcontractors, and equipment rental
- Job Cost Summary sheet with gross margin calculated per project
- 12-month annual P&L that updates automatically from monthly entries
- Gross margin and net income auto-calculated for every month
- Visual dashboard with margin trends and cost breakdown charts
How to Use This Construction P&L Spreadsheet
Download the .xlsx file and open it in Excel or Google Sheets — no macros or setup beyond your own numbers. Start with the Monthly P&L sheet. The revenue categories cover the main contract types most general contractors and specialty trades use; rename or remove any that don't match your mix. The cost section is pre-loaded with the line items that drive construction gross margin — direct labor, materials, subcontractors, equipment rental, and job-specific insurance. Review them against your chart of accounts and adjust as needed. Most contractors find setup takes about 15–20 minutes.
Once the structure is set, enter your monthly revenue and direct costs from your job cost reports or accounting software. The Job Cost Summary sheet is worth filling out project by project: enter each active job's contract value, change orders, and actual costs, and the sheet calculates gross profit and margin per job automatically. This is the view that tells you whether individual projects are performing to their bid margins — information that the monthly total doesn't surface on its own.
15 minutes from download to your first P&L
Download the template, enter last month's job revenue and costs, and see your construction company's gross margin and net income — with a job-by-job cost breakdown included.
Why Every Construction Company Needs a P&L Template
Construction companies operate at some of the thinnest net margins in any industry — typically 2–7% net profit on revenue — despite gross margins that look healthy on paper at 20–35%. The gap between gross and net is where overhead swallows profit: estimating salaries, vehicle costs, general insurance, bonding, and office expenses that have to be covered before any money reaches the bottom line. Most contractors have a good feel for individual job performance, but without a structured P&L to review monthly, overhead creep can quietly erode margins across the entire company.
A construction P&L needs a structure that reflects how the business actually earns revenue. Contract revenue should be split by contract type — fixed-price jobs carry different risk and margin profiles than cost-plus work or time-and-materials billing. Change orders should be tracked separately because they often have higher margins than the original contract scope and represent a meaningful revenue line for active contractors. On the cost side, the split between direct labor, materials, subcontractors, and equipment rental matters: subcontractor costs can run 30–50% of revenue on some projects, and tracking them as a percentage of revenue helps you see whether your reliance on subs is growing and what that means for your gross margin.
Construction Industry at a Glance
Financial templates built for construction companies — from general contractors to specialty trades. Pre-loaded with job costing categories, bid tracking, and project-based financials.
Revenue Drivers
- Project contracts
- Change orders
- Service & maintenance
- Material markups
Key Cost Categories
- Materials
- Labor (direct)
- Subcontractors
- Equipment rental
- Permits & insurance
- Overhead
Typical Margins
Gross: 20-35% · Net: 2-7%
Seasonality
Peak activity spring through fall; winter slowdown in northern climates. Year-end push to close projects.
Key Performance Indicators
Construction P&L Template FAQ
More Construction Templates
Construction Balance Sheet Template for Excel
$29
Construction Budget Template for Excel
$29
Construction Business Plan Template for Excel
$39
Construction Cash Flow Template for Excel
$29
Construction Expense Tracker Template for Excel
$29
Construction Financial Model Template for Excel
$29
Construction Income Statement Template for Excel
$29
Construction Invoice Template for Excel
$29
Construction KPI Dashboard Template for Excel
$29
Construction Pro Forma Template for Excel
$29
Construction Project Budget Template for Excel
$29
Construction Sales Forecast Template for Excel
$29
Construction Business Valuation Template for Excel
$29
Construction P&L Template
$29