Car Wash Sales Forecast Template
Project car wash revenue by service type, membership tier, and season — with driver-based formulas built around cars washed per day, average ticket, and subscription growth.
What's Inside This Car Wash Sales Forecast Template
This template includes 5 worksheets, each designed for a specific part of your car wash financial workflow:
Assumptions
The starting point for the entire forecast.
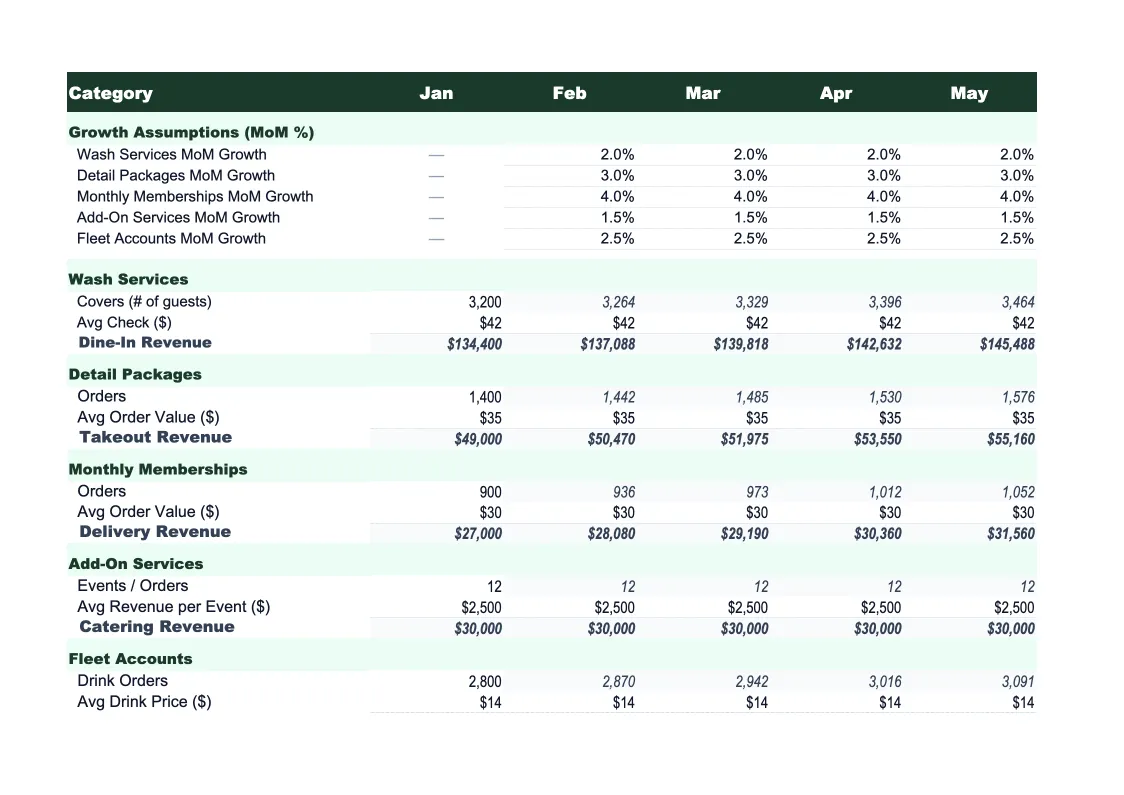
Monthly Revenue Forecast
The core projection sheet, showing month-by-month revenue broken out by channel: retail wash sales (calculated from daily volume × days per month × avg ticket), membership recurring revenue (active subscribers × monthly fee), detailing and add-on services, and fleet account billing.
Membership Model
A dedicated sheet for modeling membership subscription growth and churn — the revenue line that most car wash operators underestimate in early forecasts.
Annual Summary
A 12-month rollup that aggregates all revenue channels into a single view.
Actual vs Forecast
As the year progresses, enter your actual monthly revenue figures here alongside the original forecast.
Car Wash Sales Forecast Template Features
- Driver-based model using cars per day, avg ticket, and membership count inputs
- Separate membership revenue model with churn rate and tier tracking
- Monthly seasonality adjustments for cold-climate and weather-sensitive markets
- Revenue split by retail wash, memberships, detailing, and fleet accounts
- Actual vs forecast variance tracking with conditional formatting
- Revenue per bay and membership as % of total revenue KPIs
How to Use This Car Wash Sales Forecast Spreadsheet
Start with the Assumptions sheet — it's the only place you enter inputs. Fill in your current daily wash volume, average retail ticket, active membership count and average fee, and your seasonal adjustment percentages by month. If you're a new location or just added a membership program, use conservative estimates: most operators underestimate churn and overestimate new member sign-ups in the first year. The Monthly Revenue Forecast and Membership Model sheets update automatically as you fill in the Assumptions.
Once the assumptions are set, review the Monthly Revenue Forecast sheet to check whether the projections look realistic. Compare the revenue per bay figure against industry benchmarks — a single express tunnel typically generates $600,000–$1.2M+ annually at healthy volumes. If you have multiple bays or a full-service tunnel, adjust the daily volume and ticket inputs to reflect each revenue center. The Membership Model sheet lets you stress-test churn: try moving churn from 5% to 8% and watch what happens to annual recurring revenue — the difference often runs into five figures.
15 minutes from download to your first car wash forecast
Download the template, plug in your wash volume and membership count, and see your car wash's full revenue picture — monthly projections, membership model, and variance tracking included.
Why Every Car Wash Needs a Sales Forecast Template
Car wash revenue is more predictable than most small businesses realize — but only if you're modeling it the right way. Retail wash sales are volume-driven: cars per day times average ticket. Membership revenue is subscription-driven: members times monthly fee minus churn. Fleet accounts are contract-driven: scheduled visits billed monthly. When you break revenue into these three channels and forecast each separately, you stop lumping everything together and start seeing which part of the business is actually growing — and which is masking a decline somewhere else.
Membership revenue has changed the economics of the car wash industry significantly. A well-run unlimited membership program can generate 40–60% of a site's total revenue with near-zero marginal cost per wash once members are enrolled. But the forecast math only works if you're honest about churn. Industry-average monthly churn for car wash memberships runs 6–10%, which means you're replacing 72–120% of your member base over a year. A forecast that assumes 2% churn will dramatically overestimate recurring revenue — and most acquisition spend decisions get made off that number.
Car Wash Industry at a Glance
Financial templates built for car wash businesses — from self-service bays and in-bay automatics to full-service tunnels and mobile detailing operations.
Revenue Drivers
- Retail wash sales
- Membership/subscription plans
- Fleet account billing
- Detailing & add-on services
Key Cost Categories
- Labor
- Chemicals & supplies
- Water & utilities
- Equipment maintenance & repairs
- Rent & occupancy
- Credit card processing fees
Typical Margins
Gross: 75-85% · Net: 15-45%
Seasonality
Spring and fall typically peak — customers wash after winter salt and before summer heat; slowest in deep winter in cold climates and during rainy stretches.
Key Performance Indicators
Car Wash Sales Forecast Template FAQ
More Car Wash Templates
Car Wash Balance Sheet Template for Excel
$29
Car Wash Budget Template for Excel
$29
Car Wash Business Plan Template for Excel
$39
Car Wash Cash Flow Template for Excel
$29
Car Wash Expense Tracker Template for Excel
$29
Car Wash Financial Model Template for Excel
$29
Car Wash Income Statement Template for Excel
$29
Car Wash Invoice Template for Excel
$29
Car Wash KPI Dashboard Template for Excel
$29
Car Wash P&L Template for Excel
$29
Car Wash Pro Forma Template for Excel
$29
Car Wash Project Budget Template for Excel
$29
Car Wash Valuation Template for Excel
$29
More Sales Forecast Templates
Car Wash Sales Forecast Template
$29