Accounting Firm P&L Template
Track your accounting practice's profitability by service line, monitor utilization and realization rates, and see exactly where margin comes from — with a P&L built for how CPA firms actually operate.
What's Inside This Accounting Firm P&L Template
This template includes 4 worksheets, each designed for a specific part of your accounting firm financial workflow:
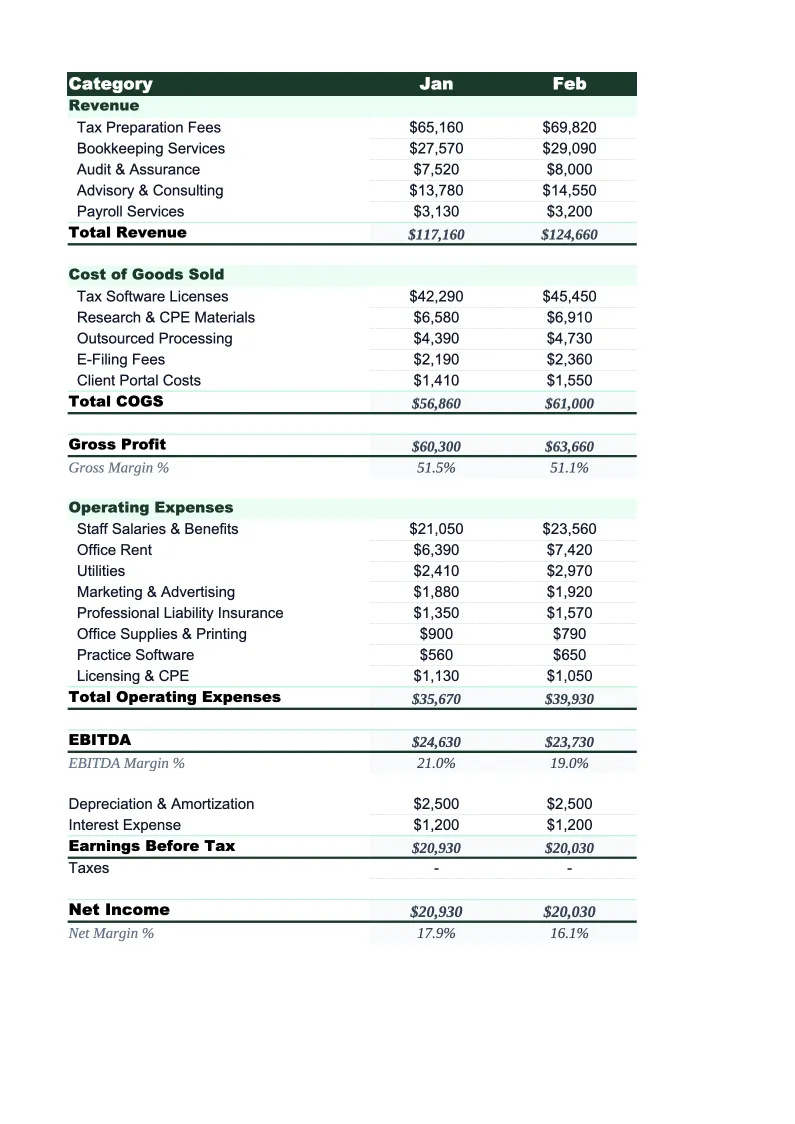
Monthly P&L
The core worksheet for tracking monthly revenue and expenses.
Annual Summary
A 12-month rollup that aggregates all monthly P&L data automatically.
Service Line P&L
A profitability breakdown by service line — tax, audit, CAS, advisory, and payroll, or whichever lines your firm runs.
Dashboard
A one-page summary with charts covering revenue trends, expense composition, net income, and key performance ratios.
Accounting Firm P&L Template Features
- Revenue split by service line: tax, audit, CAS, advisory, and payroll
- Service line profitability tracker with contribution margin per line
- Utilization rate, realization rate, and collection rate on the Dashboard
- E&O malpractice insurance and CPE tracked as separate expense line items
- Pre-loaded with technology costs for tax software and practice management platforms
- Monthly P&L with 12-month annual rollup
How to Use This Accounting Firm P&L Spreadsheet
Download the .xlsx file and open it in Excel or Google Sheets — no macros or add-ins required. Start on the Monthly P&L sheet: review the pre-loaded service line revenue categories and expense items and adjust them to match your firm's chart of accounts. For most practices this means renaming a service line or two (some firms call CAS 'outsourced accounting' or 'managed accounting') and possibly consolidating a few expense categories. The structure works for solo CPA practices, small partnerships, and multi-partner firms without significant changes.
Once the categories are set, enter your current month's revenue by service line and expenses by category. If your practice tracks billing and collections separately — as most firms should — enter collected revenue rather than billed amounts for a true P&L view. The Service Line P&L sheet is worth setting up early: enter each line's revenue and direct costs to see contribution margin by service. The Annual Summary and Dashboard update automatically as you fill in monthly data, so the setup work you do in month one pays off for the rest of the year.
15 minutes from download to your first accounting firm P&L
Download the template, plug in your numbers, and see your practice's full profitability picture — monthly P&L, service line breakdown, and key metrics included.
Why Every Accounting Firm Needs a P&L Template
Accounting firm profitability is harder to track than it looks — partly because the industry's own clients struggle with it too, and partly because the standard tools don't tell the full story. Practice management software tracks billable time and billing. QuickBooks tracks cash flow. But neither gives you a clean P&L that shows net income broken down by service line, with key ratios like realization rate and collection rate sitting next to revenue and expense figures. That gap is where firms lose visibility into what's actually driving margin.
A proper accounting firm P&L needs to reflect how the practice earns money. Tax compliance is the revenue anchor for most firms, but the economics differ from advisory work — tax has a hard busy-season deadline and benefits from efficiency at scale, while advisory and fractional CFO services typically command higher hourly rates with more variable demand. CAS work has grown significantly as the shift to cloud accounting accelerated, and many firms find it generates better margins than compliance work when priced correctly. Separating these on the P&L shows which service lines are actually profitable after direct staff costs, software, and subcontractor fees.
Accounting Firm Industry at a Glance
Financial templates built for accounting firms and CPA practices — from solo practitioners to multi-partner firms. Pre-loaded with billable hour tracking, realization rate calculations, and service categories that reflect how accounting firms actually bill.
Revenue Drivers
- Tax preparation and planning
- Audit and assurance
- Bookkeeping and client accounting services (CAS)
- Advisory and fractional CFO services
- Payroll processing
Key Cost Categories
- Professional staff salaries and benefits
- Administrative staff
- Occupancy and rent
- Technology and software (tax, practice management)
- Malpractice (E&O) insurance
- Marketing and business development
- CPE and professional development
- Subcontractors and offshore staff
Typical Margins
Gross: 50-65% · Net: 20-35%
Seasonality
Heavy busy season January through April 15; secondary crunch in September through October 15 for extensions. Slowest months are July and August.
Key Performance Indicators
Accounting Firm P&L Template FAQ
More Accounting Firm Templates
Accounting Firm Balance Sheet Template for Excel
$29
Accounting Firm Budget Template for Excel
$29
Accounting Firm Business Plan Template for Excel
$39
Accounting Firm Cash Flow Template for Excel
$29
Accounting Firm Expense Tracker Template for Excel
$29
Accounting Firm Financial Model Template for Excel
$29
Accounting Firm Income Statement Template for Excel
$29
Accounting Firm Invoice Template for Excel
$29
Accounting Firm KPI Dashboard Template for Excel
$29
Accounting Firm Pro Forma Template for Excel
$29
Accounting Firm Project Budget Template for Excel
$29
Accounting Firm Sales Forecast Template for Excel
$29
Accounting Firm Valuation Template for Excel
$29
Accounting Firm P&L Template
$29