Car Wash Financial Model Template
Model retail wash throughput, unlimited membership subscriptions, and fleet account billing — then see your car wash's unit economics, cash position, and 24-month P&L in one connected spreadsheet.
What's Inside This Car Wash Financial Model Template
This template includes 6 worksheets, each designed for a specific part of your car wash financial workflow:
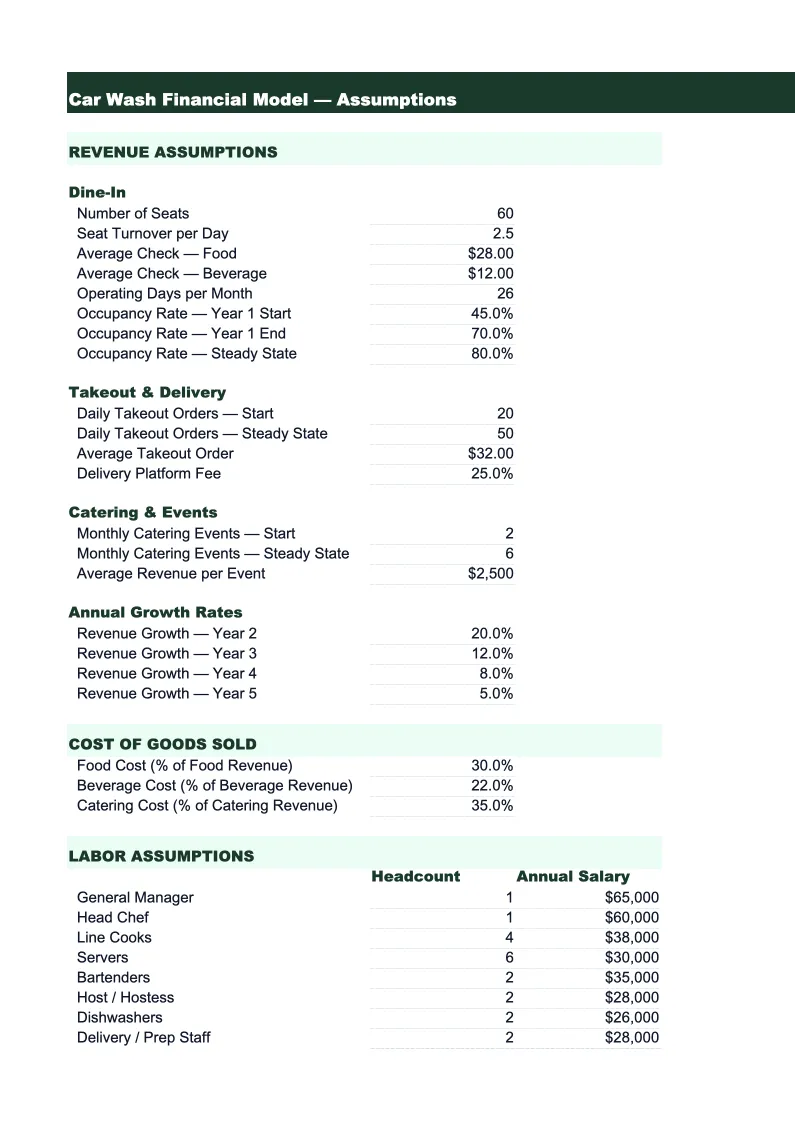
Assumptions
The single input sheet that drives every calculation in the model.
Revenue Projections
A 24-month revenue build organized by four revenue streams: retail wash sales (broken out by tier — basic, deluxe, and premium — using your daily car count and retail price assumptions), unlimited membership subscriptions (subscriber count × monthly fee, with member growth and churn applied each month), fleet account billing (accounts × cars per account × contracted rate), and detailing and add-on services (modeled as a percentage of retail wash volume or as a standalone unit with separate pricing).
Operations Model
A month-by-month view of your car wash's operational throughput and membership base.
P&L
A 24-month profit and loss statement that pulls revenue from the Revenue Projections sheet and costs from your Assumptions inputs.
Cash Flow
A monthly cash flow statement that tracks the actual movement of cash through your car wash business.
Dashboard
A one-page visual summary designed for lender presentations, investor meetings, or annual planning reviews.
Car Wash Financial Model Template Features
- Revenue model split by stream: retail wash tiers, unlimited memberships, fleet accounts, and detailing projected separately
- Membership waterfall model — new subscribers, monthly churn rate, and average member tenure drive recurring revenue projections
- Cost per car and average ticket value calculated automatically each month from throughput and cost inputs
- Seasonal multipliers pre-set for spring/fall volume peaks and winter slowdowns with adjustable monthly factors
- Bay or tunnel utilization rate tracked monthly alongside revenue per bay — key metrics for site-level performance
- 24-month P&L with gross and net margin benchmarks displayed alongside projections for car wash businesses
How to Use This Car Wash Financial Model Spreadsheet
Start in the Assumptions sheet. Enter your site setup — bay or tunnel count, operating hours per day, and operating days per month — then fill in your daily car count by wash tier and the retail price for each. If you're an existing operation, pull your last 90 days from your POS system and calculate average daily cars per tier, average ticket value, and your current membership subscriber count. If you're modeling a new location, start conservatively: 150–200 cars per day is a reasonable assumption for a single-bay express location in year one, scaling to 300–400 as the membership base builds. Enter your current or projected subscriber count, the monthly membership price, and a realistic churn rate — 4–6% monthly is typical for early-stage programs. Then enter your variable costs: chemical cost per car (typically $1.50–$3.00 depending on chemistry and wash type), your fully-loaded labor cost per hour, utility budgets, rent, and maintenance reserve. The model will immediately show your revenue and margin projections.
Once your Assumptions look right, review the Operations Model and Revenue Projections sheets. The Operations Model shows whether your daily throughput assumptions produce a realistic bay utilization rate — exceeding 90% utilization consistently signals that you're capacity constrained, which either limits revenue or calls for a second lane. Check the membership waterfall: if your monthly churn assumption is 5% and you're adding 20 new members per month, the model will show you whether your subscriber base is growing, stable, or shrinking, and what your terminal membership count looks like at current growth rates. Review the Revenue Projections to confirm the mix between retail, membership, and fleet revenue is realistic for your market and business format. Then check the P&L: if gross margin is below 70%, look at whether chemical costs or credit card processing fees are the driver. If net margin is below 10%, examine whether fixed overhead — particularly rent — is too high relative to your volume.
15 minutes from download to your first car wash projection
Download the template, plug in your daily car count and membership numbers, and see your car wash's full financial picture — revenue by stream, cost per car, membership growth, and 24-month P&L included.
Why Every Car Wash Needs a Financial Model
Car wash unit economics look simple on the surface — cars in, cash out — but the underlying model is more complex than most operators plan for. The shift from transactional retail washing to unlimited membership programs over the past decade has changed the economics significantly. A site with 400 members generating $30/month each produces $12,000 in predictable monthly revenue before a single retail car pulls through. But that same membership base creates a cost-per-car problem: members wash more often than retail customers (often 3–5 times per month vs. 1–1.5 times), which raises your chemical and water cost per revenue dollar. Without a model that tracks cars washed per subscriber per month alongside membership revenue, operators underestimate variable costs and overestimate membership profitability.
The two metrics that define a healthy car wash financial model are cost per car and revenue per bay. Cost per car should cover all variable inputs — chemicals, water, processing fees, and any variable labor — and typically runs $2.50–$5.00 for express exterior washes, higher for full-service and detailing. Revenue per bay (or per tunnel lane per hour) determines whether your site is operating efficiently. Express tunnel washes targeting 100–120 cars per hour per lane are generating strong revenue per lane-hour; self-service bays averaging 3–4 cars per bay per hour are producing less but at much lower operating cost. A financial model built around these two inputs — rather than just top-line revenue — lets operators quickly see whether volume, pricing, or cost is the lever to pull when margins compress.
Car Wash Industry at a Glance
Financial templates built for car wash businesses — from self-service bays and in-bay automatics to full-service tunnels and mobile detailing operations.
Revenue Drivers
- Retail wash sales
- Membership/subscription plans
- Fleet account billing
- Detailing & add-on services
Key Cost Categories
- Labor
- Chemicals & supplies
- Water & utilities
- Equipment maintenance & repairs
- Rent & occupancy
- Credit card processing fees
Typical Margins
Gross: 75-85% · Net: 15-45%
Seasonality
Spring and fall typically peak — customers wash after winter salt and before summer heat; slowest in deep winter in cold climates and during rainy stretches.
Key Performance Indicators
Car Wash Financial Model Template FAQ
More Car Wash Templates
Car Wash Balance Sheet Template for Excel
$29
Car Wash Budget Template for Excel
$29
Car Wash Business Plan Template for Excel
$39
Car Wash Cash Flow Template for Excel
$29
Car Wash Expense Tracker Template for Excel
$29
Car Wash Income Statement Template for Excel
$29
Car Wash Invoice Template for Excel
$29
Car Wash KPI Dashboard Template for Excel
$29
Car Wash P&L Template for Excel
$29
Car Wash Pro Forma Template for Excel
$29
Car Wash Project Budget Template for Excel
$29
Car Wash Sales Forecast Template for Excel
$29
Car Wash Valuation Template for Excel
$29
More Financial Model Templates
Car Wash Financial Model Template
$29