Auto Repair P&L Template
Track labor revenue, parts sales, and shop overhead in a P&L built around how auto repair shops actually make — and lose — money.
What's Inside This Auto Repair P&L Template
This template includes 4 worksheets, each designed for a specific part of your auto repair financial workflow:
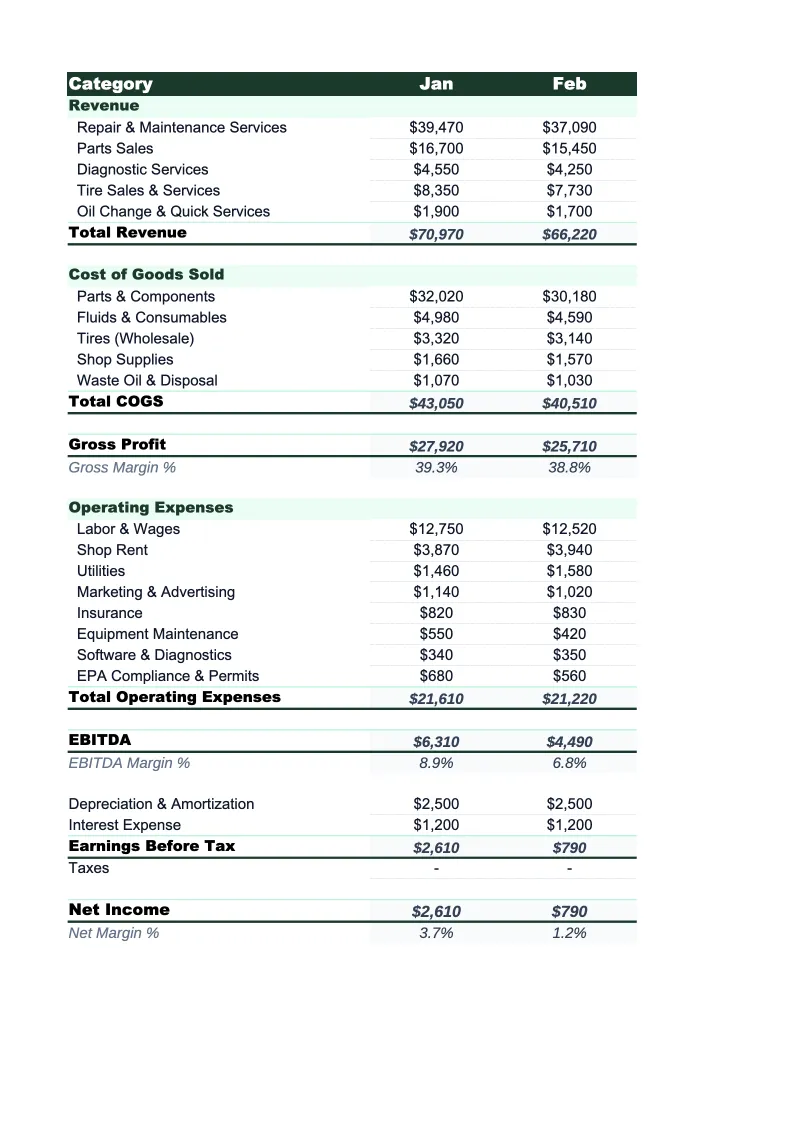
Monthly P&L
The core worksheet for entering each month's revenue and costs.
Annual P&L
A 12-month summary that pulls from the Monthly P&L sheet automatically.
Labor & Parts Analysis
A worksheet that breaks down the two primary revenue and cost drivers in any auto repair shop.
Dashboard
A one-page summary with charts and KPIs drawn from the monthly entries.
Auto Repair P&L Template Features
- Revenue split by service type: labor, parts, oil changes, diagnostics, tire sales, and shop supplies
- COGS separation of parts cost and technician labor for true gross margin visibility
- Labor & Parts Analysis sheet tracking ELR, technician efficiency, and parts margin monthly
- Average Repair Order (ARO) and car count calculations built into the analysis sheet
- 12-month Annual P&L view pulling automatically from monthly entries
- Dashboard with margin trends, revenue mix charts, and key shop KPIs
How to Use This Auto Repair P&L Spreadsheet
Download the .xlsx file and open it in Excel or Google Sheets — no macros or plugins required. Start on the Monthly P&L sheet and review the pre-loaded revenue and cost categories. Check that the service categories match how your shop tracks revenue: if you don't sell tires, remove that line; if you have a dedicated alignment or ADAS calibration service, add a row for it. Review the expense section and confirm the categories align with how your accountant structures your chart of accounts. Initial setup typically takes 15–20 minutes, most of it spent customizing the line items to match your shop.
Each month, enter your revenue by service category and your parts cost and technician labor cost in the COGS section. Then switch to the Labor & Parts Analysis sheet and enter that month's car count, billable hours, and total technician hours clocked — this takes about five minutes once you're familiar with the sheet. The ELR, technician efficiency, parts margin, and ARO figures calculate automatically. If your shop management software (Mitchell, R.O. Writer, Tekmetric, or similar) produces a monthly summary report, those figures map directly onto this template.
15 minutes from download to your first P&L
Download the template, enter last month's numbers, and see your shop's gross margin, ELR, and net income — with labor and parts analysis calculated automatically.
Why Every Auto Repair Shop Needs a P&L Template
Auto repair is a business with strong gross margins on paper — labor gross margins of 60–70% are typical when labor is priced at or above the local market rate — but net margins for most independent shops land between 5% and 15%. The gap between gross and net is filled by occupancy costs, equipment, insurance, and owner compensation. Without a P&L that separates parts margin from labor margin, and operating expenses from cost of goods sold, it's difficult to know whether a profitability problem is coming from the service bay or the back office. Many shop owners who track revenue closely don't realize their effective labor rate has drifted below the market rate until they run a proper P&L.
An auto repair P&L needs to treat labor and parts as separate revenue streams with separate cost structures. Labor revenue minus technician wages gives you labor gross profit; parts revenue minus parts cost gives you parts gross profit. These two numbers behave very differently — labor margin is primarily a function of your posted labor rate and technician efficiency, while parts margin is driven by your supplier pricing, markup strategy, and whether you're losing ticket share to customers who source their own parts. Key benchmarks: a healthy shop typically targets a parts-to-labor ratio between 0.8:1 and 1.2:1, an ELR at or above the posted door rate, and a technician efficiency rate of 90–110%. Average repair order (ARO) is the single most useful top-line metric because it captures both car count and revenue per ticket.
Auto Repair Industry at a Glance
Financial templates built for auto repair shops — from single-bay independents to multi-location service centers. Pre-loaded with labor, parts, and overhead categories specific to the automotive service industry.
Revenue Drivers
- Labor (repair services)
- Parts sales
- Oil changes & maintenance
- Diagnostics & inspections
- Tire sales
- Shop supplies fees
Key Cost Categories
- Parts & materials (COGS)
- Technician labor
- Rent & occupancy
- Equipment & tools
- Utilities
- Insurance
- Marketing & advertising
- Shop supplies
Typical Margins
Gross: 50-60% · Net: 5-15%
Seasonality
Busiest in summer (June–August) and spring (March–May) for maintenance and travel prep; January–February are consistently the slowest months.
Key Performance Indicators
Auto Repair P&L Template FAQ
More Auto Repair Templates
Auto Repair Shop Balance Sheet Template for Excel
$29
Auto Repair Shop Budget Template for Excel
$29
Auto Repair Shop Business Plan Template for Excel
$39
Auto Repair Shop Cash Flow Template for Excel
$29
Auto Repair Expense Tracker Template for Excel
$29
Auto Repair Financial Model Template for Excel
$29
Auto Repair Income Statement Template for Excel
$29
Auto Repair Invoice Template for Excel
$29
Auto Repair KPI Dashboard Template for Excel
$29
Auto Repair Shop Pro Forma Template for Excel
$29
Auto Repair Shop Project Budget Template for Excel
$29
Auto Repair Sales Forecast Template for Excel
$29
Auto Repair Shop Valuation Template for Excel
$29
Auto Repair P&L Template
$29