Cleaning Service P&L Template
A P&L template built for residential and commercial cleaning businesses — with labor cost tracking, service-type revenue breakdown, and the recurring contract structure cleaning companies actually use.
What's Inside This Cleaning Service P&L Template
This template includes 5 worksheets, each designed for a specific part of your cleaning service financial workflow:
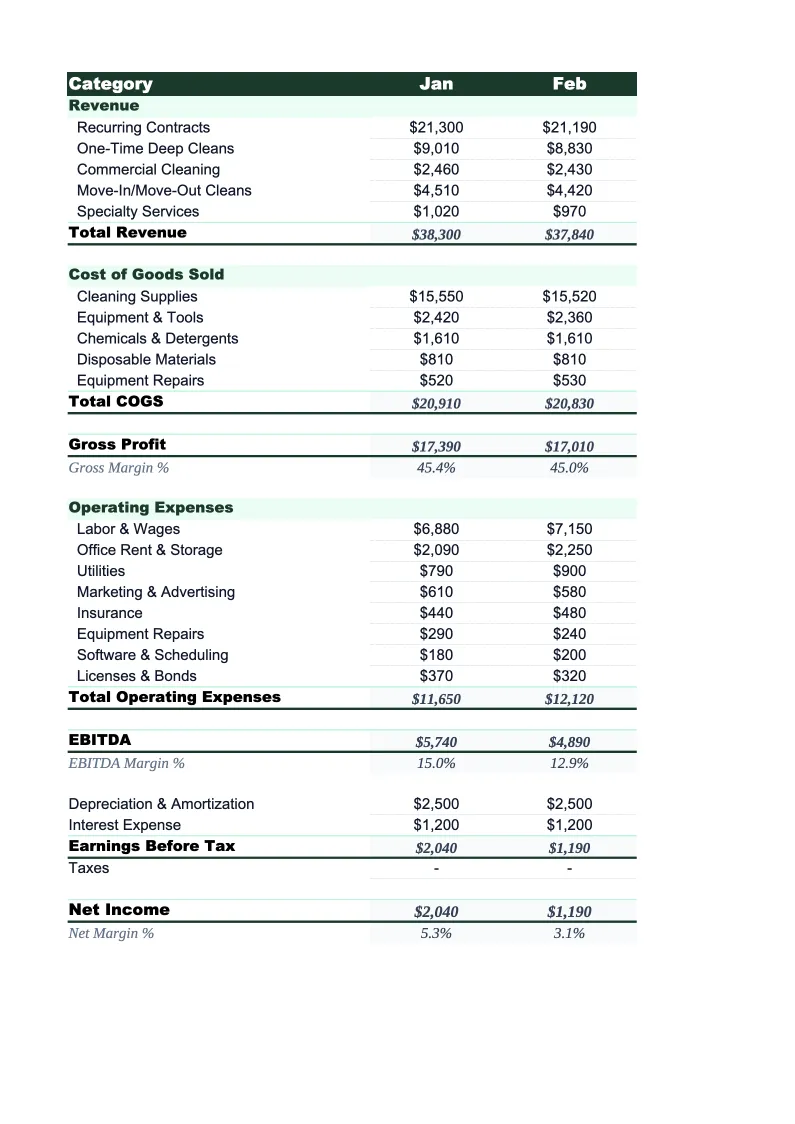
P&L Statement
The core monthly profit and loss statement for your cleaning business.
Revenue Detail
A breakdown of revenue by service category and contract type.
Labor & COGS
Labor is typically 45–55% of revenue for a cleaning business, making it the most important cost to track.
Annual Summary
A 12-month P&L rollup that pulls from each monthly statement automatically.
KPI Dashboard
A one-page visual summary of the metrics that matter most for a cleaning business: labor cost percentage, gross margin, revenue per month by service type, and net income trend.
Cleaning Service P&L Template Features
- Revenue split by residential, commercial, and one-time service types
- Labor cost tracking with payroll tax estimate built in
- Gross margin and labor-cost-as-%-of-revenue auto-calculations
- 12-month annual rollup for year-end and tax prep
- KPI dashboard with trend charts for key cleaning business metrics
- Pre-loaded with standard cleaning company chart of accounts
How to Use This Cleaning Service P&L Spreadsheet
Getting started takes about 15 minutes. Download the .xlsx file and open it in Excel or Google Sheets — no macros or add-ins required. Start on the P&L Statement sheet: review the pre-loaded revenue and expense categories, then adjust any line items that don't match how your business is structured. Most cleaning operations keep 80% of the categories and rename or add a few based on their specific service mix. If you run commercial-only or residential-only, you can remove the service types you don't use.
Once the structure looks right, enter your revenue figures by service type in the Revenue Detail sheet — the totals flow into the P&L automatically. Then fill in labor costs for each employee or crew in the Labor & COGS sheet, along with your supplies and equipment spend. The P&L calculates gross profit, your labor cost percentage, and net income as you go. If you don't have exact figures, use last month's bank statements and payroll records as a starting point.
15 minutes from download to your first P&L
Download the template, enter last month's numbers, and see your cleaning business's full profit picture — labor cost percentage, gross margin, and net income included.
Why Every Cleaning Business Needs a P&L Template
Cleaning businesses often grow without a P&L because the recurring contract model creates predictable cash flow — money comes in, cleaners get paid, supplies get restocked. But that predictability masks a real risk: labor costs are variable, clients churn without warning, and supply prices rise. Without a P&L, most cleaning operators only discover margin problems when they check their bank account and wonder where the money went. For a business running 40–55% gross margins, a 5-point labor cost increase can cut net income by a third.
A proper P&L for a cleaning business separates direct costs from operating expenses in a way that reflects how the business actually works. Labor and supplies are cost-of-service — they move directly with revenue. Insurance, vehicle costs, marketing, and owner salary are operating expenses that are relatively fixed. Keeping them separate lets you see gross margin (what you make before overhead) and net margin (what you actually keep). Healthy residential cleaning operations run 40–55% gross margin and 10–20% net. Commercial cleaning tends to run tighter margins — 35–45% gross — but with lower churn and more predictable scheduling.
Cleaning Service Industry at a Glance
Financial templates built for residential and commercial cleaning businesses — pre-loaded with labor, supplies, and overhead categories, and structured around the recurring contract model most cleaning companies run on.
Revenue Drivers
- Recurring residential contracts
- Commercial cleaning contracts
- One-time deep cleans
- Move-in/move-out cleaning
- Post-construction cleanup
Key Cost Categories
- Labor (wages & payroll taxes)
- Cleaning supplies & chemicals
- Equipment & tools
- Vehicle & transportation
- Liability insurance
- Marketing & advertising
Typical Margins
Gross: 40-55% · Net: 10-20%
Seasonality
Spring (March-April) peaks with spring cleaning demand; back-to-school surge in August-September; summer slightly slower as clients vacation; commercial cleaning demand is relatively steady year-round.
Key Performance Indicators
Cleaning Service P&L Template FAQ
More Cleaning Service Templates
Cleaning Service Balance Sheet Template for Excel
$29
Cleaning Service Budget Template for Excel
$29
Cleaning Service Business Plan Template for Excel
$39
Cleaning Service Cash Flow Template for Excel
$29
Cleaning Service Expense Tracker Template for Excel
$29
Cleaning Service Financial Model Template for Excel
$29
Cleaning Service Income Statement Template for Excel
$29
Cleaning Service Invoice Template for Excel
$29
Cleaning Service KPI Dashboard Template for Excel
$29
Cleaning Service Pro Forma Template for Excel
$29
Cleaning Service Project Budget Template for Excel
$29
Cleaning Service Sales Forecast Template for Excel
$29
Cleaning Service Business Valuation Template for Excel
$29
Cleaning Service P&L Template
$29