Construction Income Statement Example: Line Items and Benchmarks
A construction income statement example with real line items, CFMA benchmarks, and how job costing and WIP adjustments change what the P&L shows.
Construction income statements look similar to other industry P&Ls at first glance — revenue, costs, gross profit, overhead, net income. But the line items inside are different, the accounting methods are different, and the benchmarks that matter are different.
If you're a contractor reviewing your financials, a project manager trying to understand company performance, or a lender evaluating a construction business, here's what the income statement actually shows — and what to look for at each line.
How a Construction Income Statement Is Structured
A construction income statement follows this sequence:
- Contract Revenue — adjusted for WIP timing
- Cost of Revenue Earned (COGS) — direct project costs
- Gross Profit
- SG&A / Overhead — office and administrative costs
- Operating Income
- Interest Expense and Other
- Net Income Before Tax
The biggest difference from a retail or service business: every line in COGS traces back to specific job cost records. A contractor's income statement is the aggregation of dozens or hundreds of individual project-level P&Ls.
Revenue: What Gets Reported and When
Construction revenue isn't as simple as "what we billed." For contractors working on long-term contracts, the IRS generally requires the percentage-of-completion method (PCM): revenue is recognized proportional to work completed, not when invoices go out.
Percent complete is calculated as:
% Complete = Costs Incurred to Date ÷ Total Estimated Contract Costs
A contractor who has spent $800,000 on a $2M estimated-cost project is 40% complete — and recognizes 40% of the contract value as revenue, regardless of what they've billed.
The difference between what's been billed and what's been earned creates WIP adjustments:
- Overbilled (Billings in Excess of Costs): billed more than earned → reduces reported revenue, shows as a liability
- Underbilled (Costs in Excess of Billings): earned more than billed → increases reported revenue, shows as an asset
This is why construction P&Ls can look different from what the bank account shows. A contractor with $500,000 in underbillings has earned that revenue on the income statement but hasn't collected it yet.
Cost of Revenue Earned (COGS)
The cost section is where construction income statements diverge most from other industries. Standard construction COGS line items:
| Category | What It Includes |
|---|---|
| Direct Labor | Field worker wages, foreman wages billed to a specific project |
| Materials | Concrete, steel, lumber, specialty materials purchased per job |
| Subcontractors | Payments to specialty trades (electrical, plumbing, HVAC, excavation) |
| Owned Equipment | Depreciation and operating costs allocated to jobs |
| Rented Equipment | Equipment rental costs charged to specific projects |
| Fuel | Job-site fuel for equipment and vehicles |
| Job-Site Insurance | Liability and builder's risk premiums tied to specific contracts |
| Permits and Inspections | Project-specific regulatory costs |
| Project Manager Wages | PM compensation when dedicated to specific jobs |
A common accounting error: misclassifying indirect costs — equipment depreciation, warehouse labor, union benefits — as SG&A overhead instead of project costs. This inflates reported gross profit without reflecting the actual cost of completing work.
Gross Profit: What the Numbers Should Look Like
According to the CFMA's 2024 Construction Financial Benchmarker (covering 1,290 companies across fiscal year 2023):
| Contractor Segment | Typical Gross Margin |
|---|---|
| Best-in-Class (top 25%) | 21.8% |
| Industry average (all contractors) | ~14.8% |
| Specialty trade contractors | 16%+ |
| Industrial and nonresidential | 12%–16% |
| Heavy highway / infrastructure | 12%–18% |
Homebuilders run higher — the NAHB's 2025 Cost of Doing Business Study (FY2023 data) reported an average gross margin of 20.7% for residential builders, the highest since 2006.
Gross profit in construction is less stable than in most industries because of contract fade — when actual project costs exceed estimates as work progresses. A job that looked like a 20% gross margin at bid may end at 12% by completion. Monitoring gross margin by project, not just by period, is essential. Run your job-level numbers through the construction profit margin calculator to spot fade early.
SG&A / Overhead
SG&A in construction covers the costs of running the company rather than completing individual projects: office staff, executive compensation, main office rent and utilities, general insurance, estimating and business development, software, and accounting and legal fees.
CFMA 2024 benchmarks:
| Metric | Value |
|---|---|
| SG&A as % of revenue (all respondents) | 11.8% |
| SG&A as % of revenue (best-in-class) | 10.8% |
The difference looks small — 1 percentage point — but on a $10M contractor, that's $100,000 in overhead separation between average and best-in-class operators. Our construction pricing guide covers how to calculate your overhead recovery rate per billable hour and build it into every estimate.
Contractors often use the 10-10 rule as a pricing heuristic: target 10% overhead and 10% profit. It's simplified, but it aligns with where best-in-class performers actually land.
Need a ready-made income statement template for your construction?
Download a pre-built spreadsheet with industry-specific categories, formulas, and formatting.
Net Income: Industry Benchmarks
From the CFMA 2024 Benchmarker (FY2023 data, n=1,290):
| Segment | Net Income Before Taxes |
|---|---|
| All contractors (industry average) | 6.3% |
| Best-in-Class (top 25%) | 11.9% |
| Specialty trade | 6.9% |
| Heavy highway | 7.2% |
| Industrial / nonresidential | 4.1% |
The 6.3% industry average for 2023 was up from 5.0% in 2022 and above the pre-2020 five-year average of 4.7% — driven largely by strong demand and the ability to pass cost increases through to contracts.
Best-in-class contractors don't just win better jobs — they run tighter overhead and recover project costs more accurately. The gap between 11.9% and 6.3% is primarily an overhead and job cost management story.
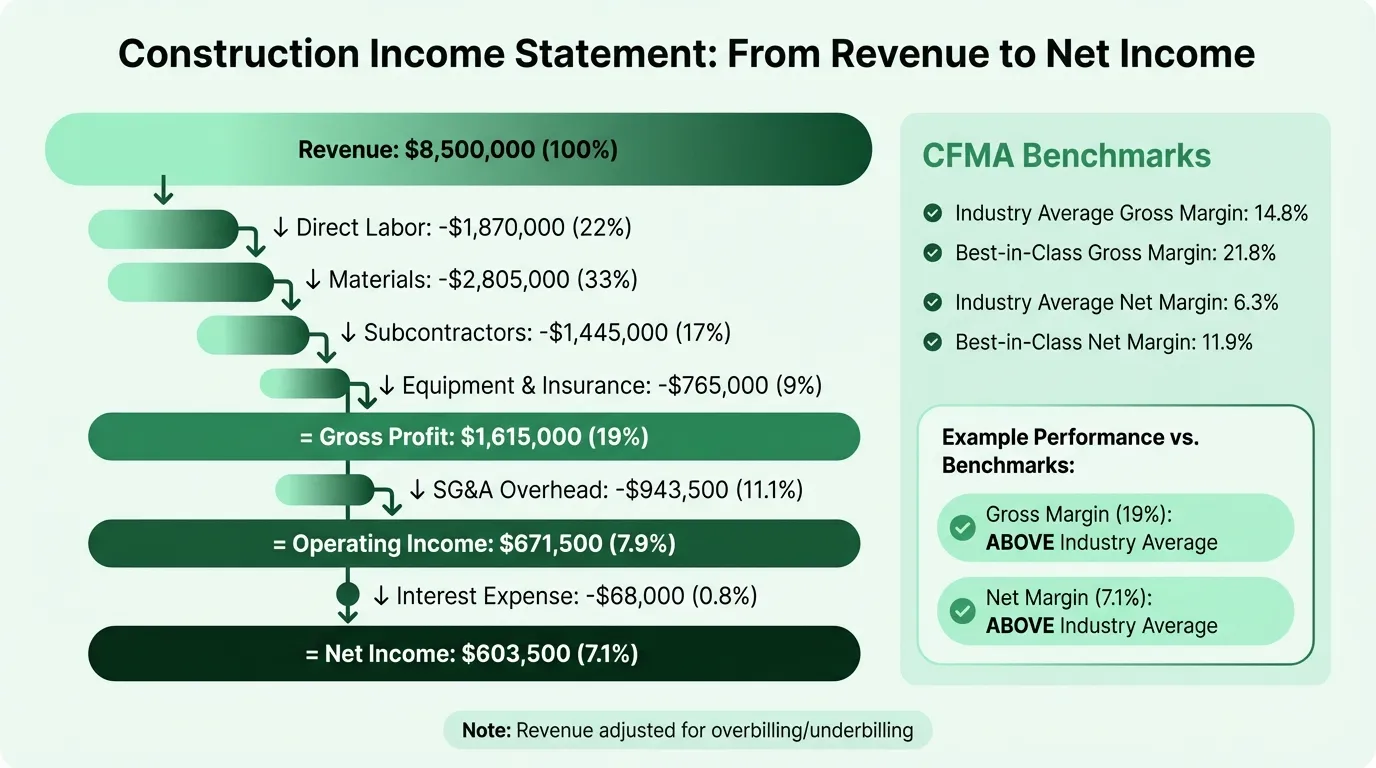
Worked Example: Mid-Size General Contractor
Here's a realistic annual income statement for a general contractor doing $8.5M in annual revenue:
Revenue
| Amount | % of Revenue | |
|---|---|---|
| Contract revenue (net of WIP adjustments) | $8,500,000 | 100% |
Cost of Revenue Earned
| Category | Amount | % of Revenue |
|---|---|---|
| Direct labor | $1,870,000 | 22.0% |
| Materials | $2,805,000 | 33.0% |
| Subcontractors | $1,445,000 | 17.0% |
| Owned and rented equipment | $510,000 | 6.0% |
| Job-site insurance and permits | $255,000 | 3.0% |
| Total Cost of Revenue | $6,885,000 | 81.0% |
| Gross Profit | $1,615,000 | 19.0% |
SG&A / Overhead
| Category | Amount | % of Revenue |
|---|---|---|
| Office staff salaries | $340,000 | 4.0% |
| Executive compensation | $255,000 | 3.0% |
| Office rent and utilities | $102,000 | 1.2% |
| General insurance | $85,000 | 1.0% |
| Software and technology | $68,000 | 0.8% |
| Marketing and estimating | $51,000 | 0.6% |
| Accounting and legal | $42,500 | 0.5% |
| Total SG&A | $943,500 | 11.1% |
Bottom Line
| Amount | % | |
|---|---|---|
| Operating Income | $671,500 | 7.9% |
| Interest expense | ($68,000) | (0.8%) |
| Net Income Before Tax | $603,500 | 7.1% |
This example lands at 7.1% net margin — above the 6.3% CFMA industry average but below best-in-class at 11.9%. The gross margin at 19.0% reflects a mid-tier general contractor who self-performs some work but relies heavily on subcontractors. For a forward-looking version of these numbers built for lender packages, see the construction pro forma example.
What Makes Construction Income Statements Hard to Read
A few things that regularly trip up readers unfamiliar with contractor financials:
Revenue ≠ billings. Under percentage-of-completion accounting, reported revenue may be more or less than what was invoiced in the period. Always check the WIP schedule alongside the income statement.
Retainage doesn't show up on the P&L. When an owner withholds 5–10% of each payment until project completion, that retained amount is still recognized as revenue (it's earned) but isn't in the bank. Retainage receivable sits on the balance sheet. On a $5M project with 10% retainage, $500,000 in earned revenue might not be collected for 12–24 months.
COGS should include indirect project costs. Equipment depreciation allocated to jobs, union benefits for field workers, and warehouse labor are project costs — not overhead. If these are sitting in SG&A, gross margin is overstated and overhead is overstated in opposite directions, making both ratios misleading.
One bad job can distort a period. A $2M contract fade — when a large project comes in significantly over budget — can swing a quarter from profitable to breakeven. This is why reviewing the income statement by project matters as much as reviewing the aggregate.
How to Use the Income Statement as a Management Tool
A construction income statement prepared quarterly or annually is a historical record. Reviewed monthly alongside the WIP schedule, it becomes a management tool.
The monthly review process:
- Check gross margin by project — which jobs are tracking above or below estimate? Contract fade shows up here first.
- Compare overhead to budget — is SG&A running above your target percentage? Office staff or administrative costs that creep up quietly erode net margin.
- Review WIP adjustments — large underbilling balances can signal billing delays or estimate problems. Large overbilling can mask weak performance on a project.
- Calculate backlog gross profit — divide committed future gross profit by annual SG&A to see how many months of overhead are covered. If backlog gross profit is $1.8M and annual SG&A is $900,000, you have roughly 24 months of overhead coverage from committed work.
The Construction Income Statement Template structures this monthly review workflow — with job cost summary rollups, WIP adjustment fields, and budget-vs-actual columns built in.
Related Templates
The income statement answers whether the company is profitable. Two other documents complete the picture:
- Construction Budget Template — set targets by cost category before the year starts, then track actuals against them monthly
- Construction Cash Flow Template — track when cash actually moves, separate from when revenue is recognized; especially important given retainage and slow payment cycles
Profitability on the income statement and cash in the bank are different things for construction contractors. A contractor can show a strong net income while watching receivables pile up and cash run thin. Both documents are needed to see the full picture.
Last updated: March 23, 2026
Frequently Asked Questions
Related Articles
Coffee Shop Income Statement Example: Revenue, Costs, and Margins
A coffee shop income statement example with beverage cost benchmarks, labor targets, prime cost rules, and a worked P&L for an independent café doing $480K/year.
Daycare Income Statement Example: Revenue, Costs, and Margins
A daycare income statement example with tuition revenue, CACFP reimbursements, staff cost benchmarks, and a worked P&L for a 50-child childcare center.
Food Truck Income Statement Example: Line Items and Benchmarks
A food truck income statement example with food cost benchmarks, unique line items like commissary and pitch fees, and a worked P&L for a single-truck operation.
Healthcare Income Statement Example: Revenue, Expenses, and Margins
A healthcare income statement example covering net patient revenue, contractual adjustments, expense benchmarks, and operating margin targets for providers.
Healthcare Pro Forma Example: What to Include and How to Build One
A practical healthcare pro forma example — covering revenue projections, payer mix, expense benchmarks, and a worked model for a new medical practice or service line.
Hotel Pro Forma Example: What to Include and How to Build One
A practical hotel pro forma example — covering RevPAR, GOP, undistributed expenses, FF&E reserves, and a worked model for acquisition or development underwriting.