Hotel Accounting: A Practical Guide for Property Managers
Hotel accounting runs on industry-specific rules most accountants don't know. This guide covers USALI, night audit, the guest/city ledger split, GOP, and key metrics.
Hotel accounting is its own discipline. Standard accounting principles apply, but the structure — the chart of accounts, the daily close, the way revenue centers are organized — follows a framework that's been specific to the lodging industry for nearly a century. Operators who understand that framework run better books. Operators who don't often find out what they're missing when a lender asks for financials they can't produce.
The USALI Framework: Why Hotels Account Differently
USALI (Uniform System of Accounts for the Lodging Industry) is the accounting standard that governs how hotels organize and report their financials. It's been in continuous development since 1926, maintained by HFTP (Hospitality Financial and Technology Professionals) and the American Hotel & Lodging Association. The current 12th edition took effect January 1, 2026.
The framework matters for three practical reasons:
Benchmarking. USALI defines standard line items so your financials can be compared directly against industry data from STR, HotStats, and similar sources. Without standardized categories, that benchmarking is impossible.
Lender and investor expectations. Banks, private equity, and hotel brands expect USALI-formatted financials. A property that submits non-standard statements signals operational immaturity before the conversation even starts.
Departmental accountability. USALI forces every revenue-generating department to stand on its own, with its own revenue and direct expense lines. You can't hide a struggling F&B operation inside a blended cost-of-revenue figure. For a detailed walkthrough of how this structure flows into a working P&L, see the hotel income statement example.
How the Hotel P&L Is Structured
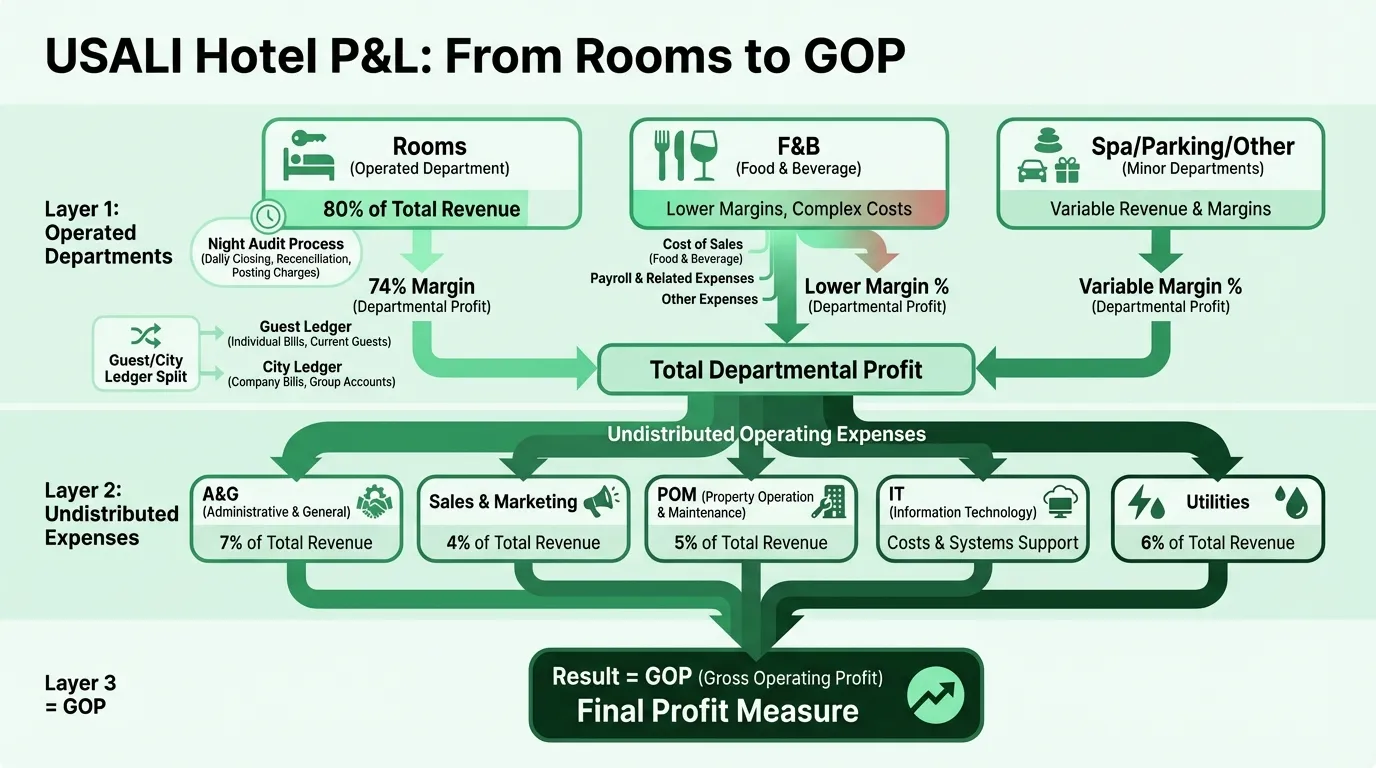
The USALI P&L has a specific architecture that differs from a standard business income statement. It flows in three layers:
Layer 1: Operated Department P&Ls
Each revenue-generating department has its own mini P&L showing revenue, direct expenses (labor and cost of goods/services), and departmental profit. The main operated departments:
| Department | Revenue | Key Direct Costs |
|---|---|---|
| Rooms | Room rate, fees | Housekeeping, amenities, laundry |
| Food & Beverage | Restaurant, bar, room service, banquets | Food/beverage cost, kitchen/service labor |
| Spa & Health Club | Treatments, memberships | Therapist labor, products |
| Parking | Daily and valet fees | Attendant labor |
| Other | Business center, retail, miscellaneous | Varies |
Rooms is the dominant department for nearly every property type. F&B is typically second in revenue but often runs thin margins — room service and hotel restaurants frequently operate at or near breakeven, subsidized by the rooms department.
All departmental profits sum to Total Operated Department Profit — what the hotel earns before overhead.
Layer 2: Undistributed Operating Expenses
These are the support costs that serve the whole hotel but can't be attributed to a single department:
- Administrative & General: General management, accounting, legal, credit card fees, security
- Sales & Marketing: Sales team, digital advertising, OTA commissions (typically 15–25% of bookings made through OTAs), loyalty program costs
- Property Operations & Maintenance (POM): Engineering staff, HVAC, plumbing, electrical repairs, preventive maintenance
- Information & Telecommunications Systems: PMS licenses, POS systems, Wi-Fi, cybersecurity
- Utilities: Electricity, gas, water
Subtract undistributed expenses from total departmental profit and you reach GOP — Gross Operating Profit.
Layer 3: Fixed Charges and Below-the-Line Items
After GOP, the P&L deducts:
- Management fees (typically 2–4% of total revenue for branded/managed hotels)
- Property insurance and taxes
- Reserve for replacement (3–5% of revenue set aside for FF&E renovation)
- Rent and lease obligations
- Depreciation and interest expense
This brings you from GOP down to EBITDA and ultimately net income. If you're building a forward-looking model from these layers, the hotel pro forma example shows how to project each tier over a multi-year hold period.
The Night Audit: Hotel Accounting's Daily Close
Most businesses close their books monthly. Hotels close daily — a process called the night audit, performed after operations wind down each evening.
The night auditor's responsibilities:
- Post room charges and taxes to every in-house guest folio
- Reconcile revenue across all departments: rooms, F&B, parking, spa
- Balance the guest ledger — every folio should match the sum of charges and payments
- Identify and resolve rate variances — cases where the rate charged doesn't match the rate in the reservation
- Generate end-of-day reports — room revenue, occupancy, tax summary
- Roll the business date — closing out the current day and opening the next
The night audit is where billing errors are caught. A wrong room rate or duplicate charge found at audit is a two-minute fix. The same error discovered two weeks later requires reconstruction across multiple reporting periods and often an uncomfortable call to the guest.
In modern hotels, property management systems (PMS) automate much of the night audit — automated posting of room charges, PMS-POS integrations, and digital revenue reconciliation — but the reconciliation review and discrepancy resolution still require human oversight.
Need a ready-made p&l template for your hotel?
Download a pre-built spreadsheet with industry-specific categories, formulas, and formatting.
Guest Ledger and City Ledger
Hotels maintain two distinct accounts receivable subledgers that have no real equivalent in most other industries.
Guest ledger (front office ledger): The collection of all open folios for currently registered, in-house guests. Each guest has a running bill that accumulates room charges, restaurant charges, parking, spa services, and incidentals in real time. At checkout, the folio is settled and the account closes. Guest ledger balances represent money owed by guests who are present at the property.
City ledger: Accounts receivable for post-departure balances — guests who've checked out and charged to a corporate direct-bill account, group master bills, and OTA/credit card receivables pending settlement. City ledger balances require invoice collection and carry genuine credit risk.
The practical implication: your accounts receivable balance at any point is not a single number. A $180,000 A/R total might include $40,000 in guest ledger (in-house folios that will settle today and tomorrow) and $140,000 in city ledger (corporate and group accounts that need to be invoiced and collected). Blending them into one line obscures collection risk.
On the balance sheet, the Hotel Balance Sheet Example shows how these two A/R categories sit separately — along with advance deposits (a liability) from guests who've paid for future stays.
Key Hotel Financial Metrics
Standard accounting ratios still apply — current ratio, debt-to-equity — but hotel performance management runs on a set of industry-specific metrics.
ADR (Average Daily Rate)
ADR = Total Room Revenue ÷ Rooms Sold
The average rate charged per occupied room. Measures pricing power in isolation — it doesn't account for how many rooms sat empty.
Occupancy Rate
Occupancy = Rooms Sold ÷ Rooms Available × 100
What percentage of inventory was actually sold. High occupancy with low ADR can be as problematic as high ADR with low occupancy.
RevPAR (Revenue Per Available Room)
RevPAR = ADR × Occupancy Rate
Or equivalently: Total Room Revenue ÷ Total Rooms Available
RevPAR is the core performance metric because it captures both rate and occupancy in a single number. You can run your property's numbers through our hotel profit margin calculator to benchmark against industry averages. According to Actabl/ProfitSword data (YTD Q3 2025), industry-wide RevPAR ran $119.22, with luxury properties at $195.22 and midscale at $91.65.
TRevPAR (Total Revenue Per Available Room)
Extends RevPAR to include all revenue streams — F&B, spa, parking, and ancillary income. More relevant for full-service properties where non-rooms revenue is material.
GOPPAR (Gross Operating Profit Per Available Room)
GOPPAR = GOP ÷ Total Rooms Available
Converts GOP into a per-room metric so properties of different sizes can be compared on an apples-to-apples basis. This is the closest thing hotels have to a per-unit profitability measure. According to HVS, industry-wide GOP margins declined to 35.4% in 2024 as labor and operating costs outpaced revenue growth — with total compensation in accommodation and food service rising 26.5% between 2020 and 2024 (Bureau of Labor Statistics).
Common Hotel Accounting Mistakes
Blending revenue streams. Combining rooms, F&B, parking, and spa revenue into a single revenue line makes departmental performance invisible and benchmarking against USALI data impossible. Each department needs its own P&L.
Inconsistent night audit discipline. Skipping or rushing the night audit lets rate discrepancies, unposted charges, and folio errors accumulate. These become disproportionately expensive to fix at month-end close.
OTA reconciliation errors. OTAs typically remit net of commission — they pay the hotel's share after deducting their fee. If the hotel records gross revenue without separately tracking the OTA commission as a marketing expense, it misstates both revenue and costs. Timing mismatches between OTA payment cycles and accounting periods compound the problem.
Mismatched revenue recognition timing. Room revenue belongs to the night of the stay, not when payment was received. Advance deposits, group prepayments, and OTA payouts often arrive before or well after the stay. Without careful tracking, revenue gets recognized in the wrong period.
Mixing up the ledgers. Failing to maintain separate guest ledger and city ledger subledgers makes A/R reconciliation difficult and hides collection risk. Corporate accounts that are aging in the city ledger don't look overdue when buried in a combined A/R balance.
Neglecting the FF&E reserve. Many independent hotels skip formal FF&E reserve accounting because it reduces reported income. The result: deferred maintenance accumulates, renovation costs hit as surprise capital expenditures, and lenders find under-reserved balance sheets when refinancing is needed. Industry standard is 3–5% of gross revenues annually. Track these allocations alongside your other operating costs with the Hotel Expense Tracker Template.
Rate variance left unresolved. Front desk discounts, complimentary upgrades, and manual rate adjustments that aren't documented create unexplained gaps in the night audit rate variance report. Over time, these gaps signal revenue leakage or unauthorized discounting.
The Financial Statements Hotels Need
A well-run hotel maintains four core financial reports:
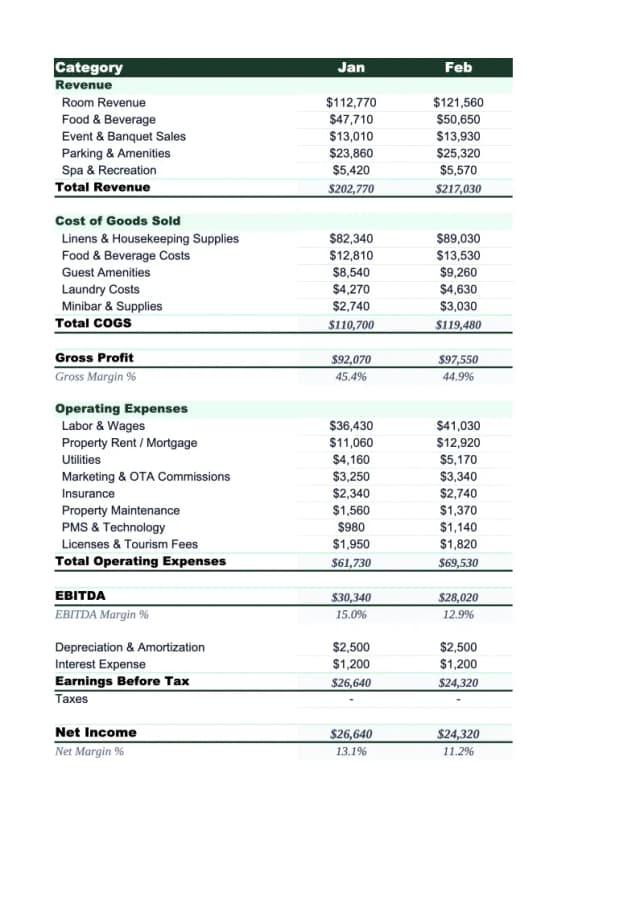
Income statement (P&L) structured under USALI — with departmental P&Ls for each revenue center, a clear undistributed expenses section, and a GOP line. Monthly, at minimum. The Hotel Income Statement Template is built to this structure, with the revenue center and expense categories already in place.
Balance sheet showing assets (cash, guest ledger, city ledger, F&B inventory, FF&E, building), liabilities (accounts payable, advance deposits as deferred revenue, mortgage), and equity. The hotel balance sheet has line items — FF&E reserves, advance deposits, two A/R categories — that a generic template won't include.
Cash flow statement tracking operating, investing, and financing cash flows. Especially important for full-service hotels with high capital expenditure cycles. The Hotel Cash Flow Template covers the monthly view lenders expect.
Operating dashboard with daily and monthly KPIs: RevPAR, ADR, occupancy, GOPPAR, labor cost percentage, food cost percentage. This is the management layer that translates the financial statements into decisions.
Together, these four reports give owners, operators, and lenders the complete picture: revenue performance by department, cost structure against USALI benchmarks, balance sheet health, and cash position — the same picture that every professionally managed hotel in the industry produces — and the basis for the investor presentations that accompany every capital raise. Build those presentations with Deckary.
Last updated: March 24, 2026
Frequently Asked Questions
Related Articles
Church Accounting Best Practices: A Practical Guide
How church accounting works — fund accounting, restricted funds, internal controls, financial reports, and the tax rules that catch churches off guard.
Church Balance Sheet Example: A Line-by-Line Breakdown
A complete church balance sheet example with real line items, fund accounting explained, and the benchmarks church boards use to assess financial health.
Construction Accounting: A Practical Guide for Contractors
Construction accounting is different from standard accounting. This guide covers job costing, WIP schedules, retainage, revenue recognition methods, and common mistakes.
Construction Balance Sheet Example: A Line-by-Line Breakdown
A complete construction company balance sheet example with real line items, WIP accounting, retainage, overbilling, and what sureties and lenders look for.
Daycare Balance Sheet Example: Line by Line
A complete daycare balance sheet example with real line items — enrollment deposits, playground equipment, subsidy receivables, and what the numbers mean.
Food Truck Balance Sheet Example: A Line-by-Line Breakdown
A complete food truck balance sheet example with real line items, truck depreciation rules, and what makes a food truck's financials different from a restaurant.