Hotel P&L Template
Track your hotel's profit and loss by department — rooms, F&B, events, and ancillary — with industry-standard metrics like ADR, RevPAR, and GOP% built in.
What's Inside This Hotel P&L Template
This template includes 4 worksheets, each designed for a specific part of your hotel financial workflow:
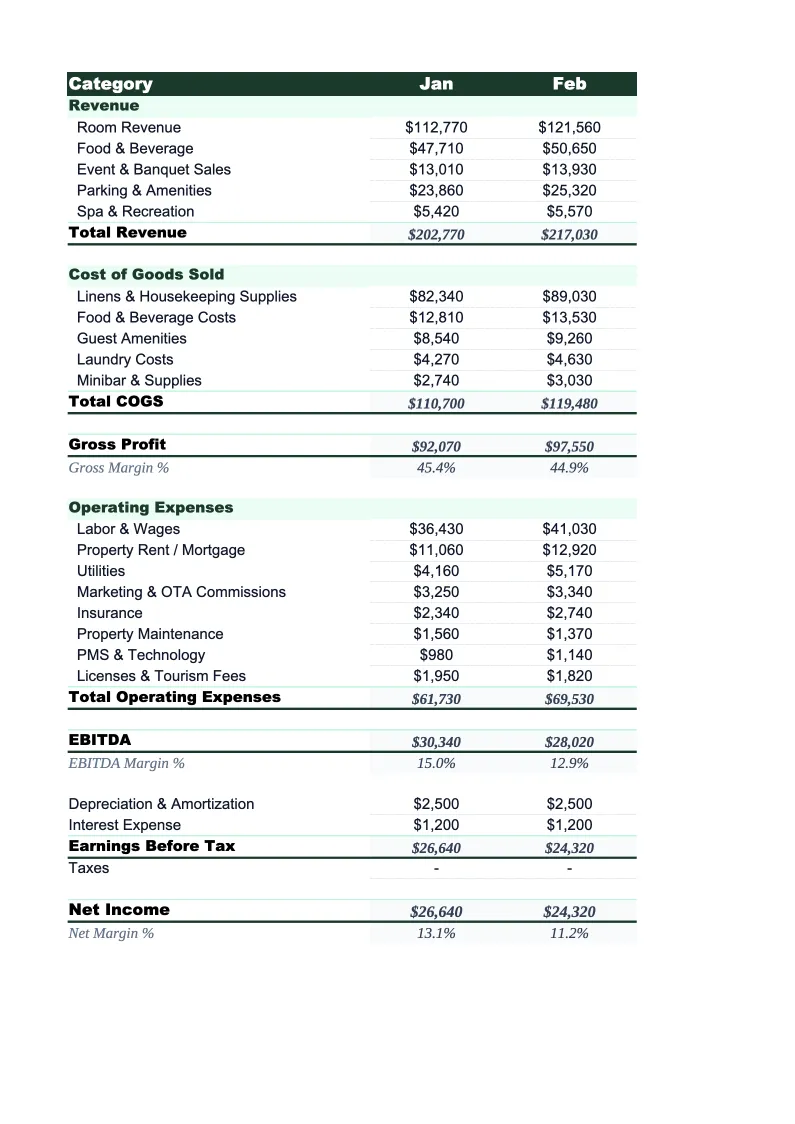
Monthly P&L
The core worksheet where you record all revenue and expenses for a given month, organized by operating department.
Annual Summary
A 12-month rollup that pulls from each monthly P&L sheet automatically.
Department P&L
A dedicated worksheet that breaks down financial performance for each operating department independently: Rooms, Food & Beverage, and Meeting & Events.
KPI Dashboard
A visual summary of the hospitality metrics that matter most — occupancy percentage, ADR (Average Daily Rate), RevPAR (Revenue per Available Room), GOP percentage, F&B revenue per occupied room, and total revenue per available room (TRevPAR).
Hotel P&L Template Features
- Department-level P&L for Rooms, F&B, and Meeting & Events
- ADR, RevPAR, and GOP% auto-calculated from your inputs
- Monthly P&L with 12-month annual rollup
- USALI-aligned department structure for easy PMS reconciliation
- OTA and franchise fee line items built in
- KPI dashboard with occupancy and RevPAR trend charts
How to Use This Hotel P&L Spreadsheet
Download the .xlsx file and open it in Excel or Google Sheets — no macros or add-ins required. Start with the Monthly P&L sheet: scan through the pre-loaded revenue and expense lines and adjust any labels that don't match your property's setup. Most hotels keep the department structure as-is and just rename a few line items — for example, swapping 'Spa & Wellness' for 'Pool & Fitness' if that better describes your ancillary revenue. Enter your room inventory count in the KPI Dashboard sheet so that ADR, RevPAR, and occupancy calculations populate correctly.
Once the structure looks right, enter your monthly room revenue, F&B revenue, and expense figures. If you're pulling from a PMS or accounting system, the department subtotals are usually the fastest starting point — enter the totals first, then break them out into line items as needed. The Department P&L sheet updates automatically from what you enter in the monthly view, giving you a clean departmental breakdown without double-entry.
15 minutes from download to your first hotel P&L
Download the template, enter your room count and monthly figures, and see your property's full financial picture — by department, by month, and by the metrics that matter.
Why Every Hotel Needs a Departmental P&L Template
Hotels operate across multiple revenue streams simultaneously, and a single-column P&L misses most of what drives profitability. Rooms revenue is the engine, but F&B, events, and ancillary income can account for 20–40% of total revenue at a full-service property. More importantly, each department has a different cost structure: rooms labor is relatively fixed, F&B cost of goods moves with covers and menu mix, and event revenue can swing by 30% depending on whether your market has a strong corporate calendar. Without departmental P&L, it's easy to see strong total revenue and miss that F&B is losing money on every cover.
Hospitality accounting follows the USALI (Uniform System of Accounts for the Lodging Industry) structure because it makes benchmarking meaningful. ADR and RevPAR are the standard metrics lenders, operators, and buyers use to evaluate a hotel's top-line performance, and GOP percentage — gross operating profit as a share of total revenue — is the primary measure of operational efficiency. For most limited-service hotels, GOP should land between 35–50%; full-service properties typically run 25–40% due to higher F&B and event labor. A hotel operating below these ranges usually has a labor problem, an OTA commission problem, or both.
Hotel Industry at a Glance
Financial templates built for hotels and hospitality businesses — from independent properties to branded franchises. Pre-loaded with room revenue, F&B, and event billing categories.
Revenue Drivers
- Room revenue (ADR × occupancy)
- Food & beverage
- Meeting & event space
- Spa & wellness
- Parking & ancillary fees
Key Cost Categories
- Labor (rooms, F&B, front office)
- Cost of F&B sold
- OTA & marketing commissions
- Utilities & property maintenance
- Franchise & management fees
- Administrative overhead
Typical Margins
Gross: 65-80% · Net: 10-20%
Seasonality
Business hotels peak weekdays and Q1/Q3; leisure properties peak summer and holidays. January is typically slowest for both segments.
Key Performance Indicators
Hotel P&L Template FAQ
More Hotel Templates
Hotel Balance Sheet Template for Excel
$29
Hotel Budget Template for Excel
$29
Hotel Business Plan Template for Excel
$39
Hotel Cash Flow Template for Excel
$29
Hotel Expense Tracker Template for Excel
$29
Hotel Financial Model Template for Excel
$29
Hotel Income Statement Template for Excel
$29
Hotel Invoice Template for Excel
$29
Hotel KPI Dashboard Template for Excel
$29
Hotel Pro Forma Template for Excel
$29
Hotel Project Budget Template for Excel
$29
Hotel Sales Forecast Template for Excel
$29
Hotel Valuation Template for Excel
$29
Hotel P&L Template
$29