Hotel Income Statement Template
Report hotel revenue and expenses by department — rooms, F&B, and ancillary — using the USALI format that lenders, owners, and management companies expect.
What's Inside This Hotel Income Statement Template
This template includes 4 worksheets, each designed for a specific part of your hotel financial workflow:
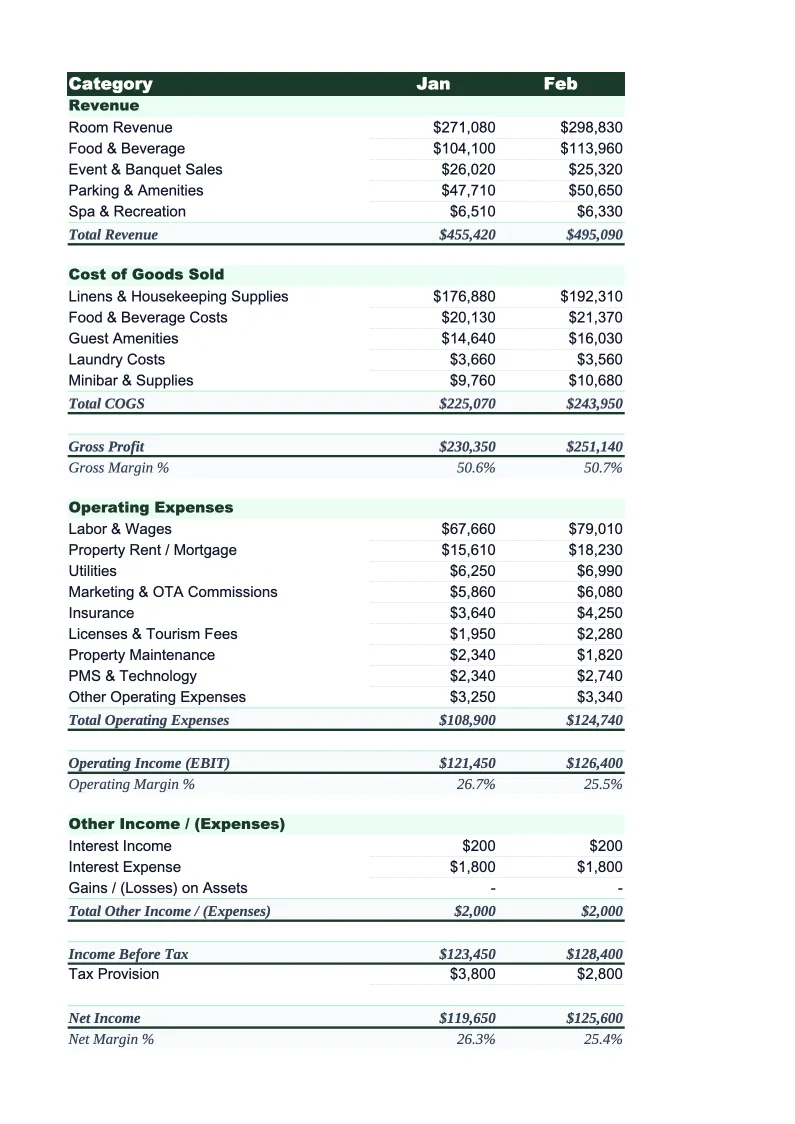
Monthly Income Statement
The core P&L worksheet structured around the Uniform System of Accounts for the Lodging Industry (USALI).
Annual Summary
A 12-month consolidated view that pulls from each monthly sheet automatically.
KPI Dashboard
A hospitality-specific metrics sheet that calculates and charts the key performance indicators used across the industry.
Department Analysis
A side-by-side breakdown of profit contribution by department — Rooms, Food & Beverage, Events, Spa, and Parking — showing each department's revenue, direct costs, and departmental profit margin.
Hotel Income Statement Template Features
- USALI-format departmental P&L for rooms, F&B, events, and ancillary revenue
- Gross Operating Profit (GOP) and Net Operating Income (NOI) calculations
- ADR, RevPAR, occupancy %, and GOPPAR auto-calculations
- 12-month annual summary with year-over-year variance
- Department-by-department profit margin breakdown
- OTA commission and franchise fee tracking as percentage of revenue
How to Use This Hotel Income Statement Spreadsheet
Start with the Monthly Income Statement sheet. Enter your available rooms and occupied rooms at the top — these drive the ADR, RevPAR, and occupancy percentage calculations throughout. Then work through each revenue department: Rooms first, then Food & Beverage, then any operated departments like Spa or Parking. The departmental expense sections beneath each revenue block are pre-populated with standard cost categories; adjust the line item names to match your property's chart of accounts. Most hotel operators keep 80–90% of the categories as-is.
Once your revenue and departmental costs are entered, fill in the undistributed expenses section: administrative & general, sales & marketing, property operations & maintenance, and utilities. These are your overhead costs that aren't directly assigned to a single department. Below that, enter your fixed charges — management fees (typically entered as a percentage of total revenue), franchise fees if applicable, property taxes, insurance, and depreciation. The sheet calculates GOP and NOI automatically. Run the KPI Dashboard sheet to verify your ADR, RevPAR, and GOP% look reasonable before finalizing.
15 minutes from download to your first hotel income statement
Download the template, enter your room count and monthly figures, and get a complete USALI-format income statement with ADR, RevPAR, and GOP% calculated automatically.
Why Every Hotel Needs a Proper Income Statement
Hotels measure profitability differently from almost any other business, and that difference matters when you're preparing financial statements for ownership review, bank covenants, or refinancing. The industry standard is USALI — the Uniform System of Accounts for the Lodging Industry — which organizes the income statement by department rather than by expense type. This format exists because hotel profitability is fundamentally driven by how each revenue center (Rooms, F&B, Events) contributes to the whole, and a generic P&L that lumps all labor or all revenue together makes it impossible to identify which departments need attention. A hotel that looks profitable on a simple P&L might be masking a loss-making F&B operation being subsidized by room revenue.
The key metrics that drive hotel financial management — ADR, RevPAR, GOPPAR, and GOP% — aren't vanity numbers. ADR tells you what you're charging; RevPAR tells you how well you're filling rooms at that price; GOPPAR (Gross Operating Profit per Available Room) tells you how efficiently your entire operation converts revenue into profit. Industry benchmarks vary significantly by property type: a select-service hotel should target GOP margins of 35–50%, while a full-service property with F&B and events might target 25–40% because of the higher overhead. Without these calculations built into your income statement, you're managing the business blind.
Hotel Industry at a Glance
Financial templates built for hotels and hospitality businesses — from independent properties to branded franchises. Pre-loaded with room revenue, F&B, and event billing categories.
Revenue Drivers
- Room revenue (ADR × occupancy)
- Food & beverage
- Meeting & event space
- Spa & wellness
- Parking & ancillary fees
Key Cost Categories
- Labor (rooms, F&B, front office)
- Cost of F&B sold
- OTA & marketing commissions
- Utilities & property maintenance
- Franchise & management fees
- Administrative overhead
Typical Margins
Gross: 65-80% · Net: 10-20%
Seasonality
Business hotels peak weekdays and Q1/Q3; leisure properties peak summer and holidays. January is typically slowest for both segments.
Key Performance Indicators
Hotel Income Statement Template FAQ
More Hotel Templates
Hotel Balance Sheet Template for Excel
$29
Hotel Budget Template for Excel
$29
Hotel Business Plan Template for Excel
$39
Hotel Cash Flow Template for Excel
$29
Hotel Expense Tracker Template for Excel
$29
Hotel Financial Model Template for Excel
$29
Hotel Invoice Template for Excel
$29
Hotel KPI Dashboard Template for Excel
$29
Hotel P&L Template for Excel
$29
Hotel Pro Forma Template for Excel
$29
Hotel Project Budget Template for Excel
$29
Hotel Sales Forecast Template for Excel
$29
Hotel Valuation Template for Excel
$29
More Income Statement Templates
Accounting Firm Income Statement Template for Excel
$29
Auto Repair Income Statement Template for Excel
$29
Car Wash Income Statement Template for Excel
$29
Church Income Statement Template for Excel
$29
Cleaning Service Income Statement Template for Excel
$29
Coffee Shop Income Statement Template for Excel
$29
Hotel Income Statement Template
$29