Nonprofit Income Statement Example: Reading a Statement of Activities
A practical nonprofit income statement example — covering revenue categories, functional expenses, net asset classes, and the benchmarks funders actually check.
A for-profit income statement answers one question: did we make money? A nonprofit income statement — formally called a Statement of Activities — answers a different question: did we use resources in accordance with our mission and donor intent?
That shift in purpose changes nearly everything about the document's structure.
Statement of Activities vs. Income Statement
The terminology matters because auditors, grantmakers, and regulators use it precisely. "Statement of activities" is the official name under FASB ASC 958, the accounting standard governing nonprofit financial statements. Calling it an income statement isn't wrong in casual conversation, but on formal filings — audited financial statements, Form 990 — you'll see "statement of activities."
The structural difference is equally important:
| For-Profit Income Statement | Nonprofit Statement of Activities | |
|---|---|---|
| Bottom line | Net income / profit | Change in net assets |
| Purpose | Show profit to owners | Demonstrate mission stewardship |
| Fund categories | Not applicable | Restricted vs. unrestricted |
| Expense classification | By type (salaries, rent) | By function (program, admin, fundraising) |
| Public disclosure | Private | Form 990 is public record |
The most significant difference for day-to-day management: nonprofit expenses must be classified by function, not just by natural category. Every dollar spent belongs to one of three buckets — program services, management and general, or fundraising. This functional breakdown is required by FASB ASC 958 and reported on Form 990 Part IX.
The Two Net Asset Classes
Post-2016 nonprofit accounting (after FASB ASU 2016-14 took effect) organizes the statement of activities into two columns:
Net assets without donor restrictions — funds the organization can use for any mission-aligned purpose. Includes unrestricted donations, program service revenue, and interest income. The board controls how these funds are deployed.
Net assets with donor restrictions — funds a donor has designated for a specific purpose, project, or time period. A foundation grant restricted to a literacy program, a pledge to be used next year, or an endowment principal that can't be spent. These funds can only be used as the donor specified.
When restricted funds fulfill their designated purpose, they move to the "without restrictions" column through a line called net assets released from restrictions. This release line is unique to nonprofit accounting — it appears as a positive addition under "without restrictions" and as a corresponding reduction under "with restrictions."
Revenue Categories for Nonprofits
Nonprofit revenue is more varied than for-profit revenue and often arrives with conditions attached:
- Contributions and gifts — individual donations, recurring giving, major gifts
- Government grants — federal, state, and local grants; frequently restricted to specific programs
- Foundation grants — private and community foundation grants; restricted or unrestricted
- Program service revenue — fees charged for delivering the mission (tuition, admission fees, membership services, clinical fees)
- Special events — galas, auctions, fundraising walks; reported as gross proceeds with event expenses shown separately
- Membership dues — annual fees from members
- Investment income — interest, dividends, and realized/unrealized gains on endowment or operating reserves
- In-kind contributions — donated goods, services, or use of facilities at fair value
One pattern that surprises people: program service revenue (fees charged for services) represents roughly 80% of total revenue across the US nonprofit sector when you include large institutions like hospitals and universities. Individual donations account for closer to 10% sector-wide. Most nonprofits are not primarily donation-funded in practice — they earn revenue by delivering services. For a deeper look at how these revenue streams are classified under GAAP, see our nonprofit accounting guide.
Functional Expense Classification
Every expense on a nonprofit statement of activities belongs to one of three functional categories:
Program Services — costs directly delivering the exempt mission. A job training nonprofit would classify trainer salaries, training materials, and classroom space here. An organization with multiple programs might have separate program lines: "Job Training," "Housing Assistance," and "Financial Coaching."
Management and General (M&G) — executive leadership, accounting and finance, human resources, legal, IT infrastructure, board meeting expenses, general insurance, and administrative overhead not directly tied to programs or fundraising.
Fundraising — development staff, grant writing, direct mail, digital fundraising, donor events, and the cost of generating contributions.
Many organizations also prepare a Statement of Functional Expenses, which shows a matrix of all natural expense categories (salaries, occupancy, technology) broken out across the three functions. This is required for voluntary health and welfare organizations and recommended for all nonprofits — it's what Form 990 Part IX requires anyway.
Need a ready-made income statement template for your nonprofit?
Download a pre-built spreadsheet with industry-specific categories, formulas, and formatting.
Worked Example: Community Social Services Nonprofit
Here's a realistic annual statement of activities for a mid-sized social services nonprofit with $2.4 million in revenue:
Revenue
| Revenue Category | Without Restrictions | With Restrictions | Total |
|---|---|---|---|
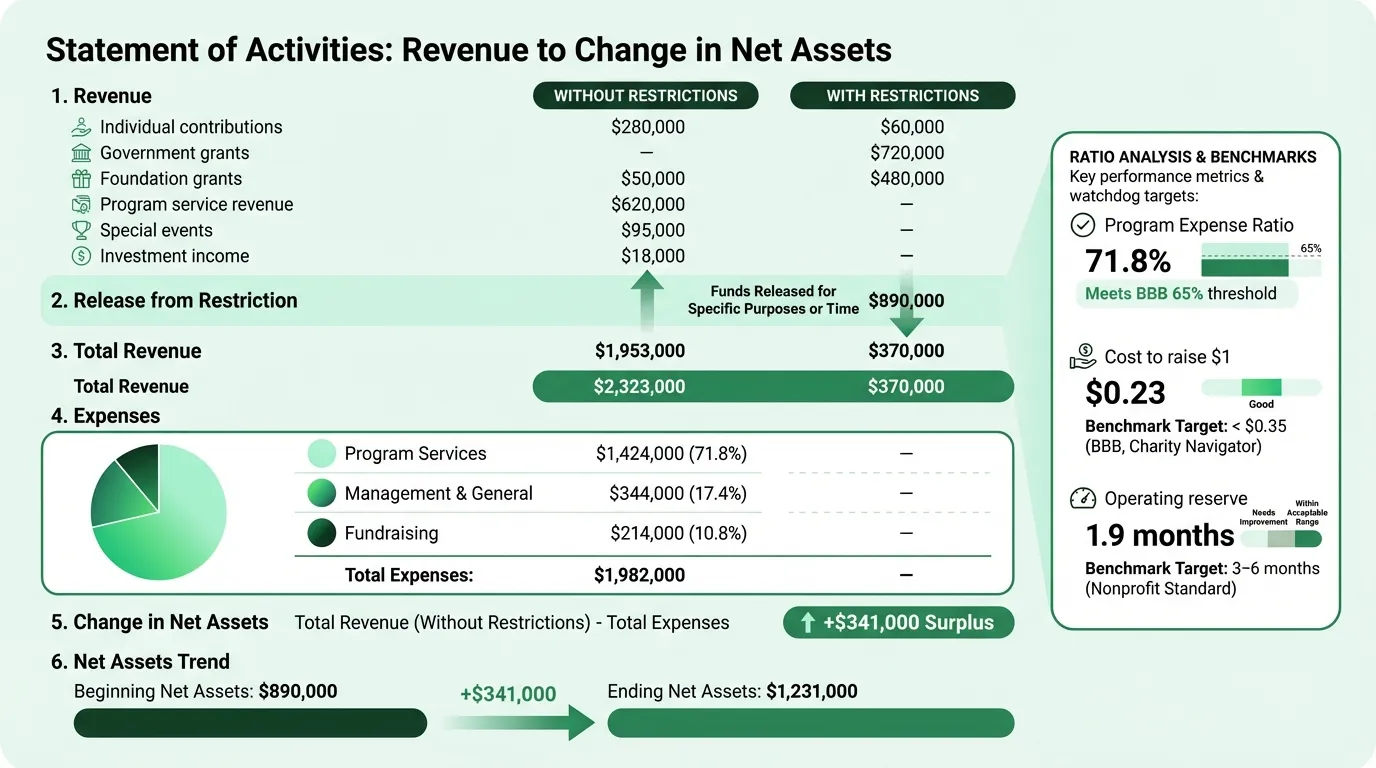
| Individual contributions | $280,000 | $60,000 | $340,000 |
| Government grants | — | $720,000 | $720,000 |
| Foundation grants | $50,000 | $480,000 | $530,000 |
| Program service revenue | $620,000 | — | $620,000 |
| Special events (net) | $95,000 | — | $95,000 |
| Investment income | $18,000 | — | $18,000 |
| Net assets released from restrictions | $890,000 | ($890,000) | — |
| Total Revenue | $1,953,000 | $370,000 | $2,323,000 |
The release line moves $890,000 from restricted to unrestricted as restricted grants are spent on their designated programs during the year.
Expenses (by Function)
| Expense Category | Program Services | Mgmt & General | Fundraising | Total |
|---|---|---|---|---|
| Salaries and wages | $860,000 | $195,000 | $118,000 | $1,173,000 |
| Employee benefits | $138,000 | $31,000 | $19,000 | $188,000 |
| Payroll taxes | $66,000 | $15,000 | $9,000 | $90,000 |
| Professional fees | $42,000 | $28,000 | $8,000 | $78,000 |
| Occupancy | $95,000 | $22,000 | $8,000 | $125,000 |
| Technology | $28,000 | $18,000 | $6,000 | $52,000 |
| Travel | $22,000 | $4,000 | $3,000 | $29,000 |
| Direct client assistance | $115,000 | — | — | $115,000 |
| Marketing and communications | $18,000 | $4,000 | $32,000 | $54,000 |
| Insurance | $9,000 | $12,000 | $3,000 | $24,000 |
| Other expenses | $31,000 | $15,000 | $8,000 | $54,000 |
| Total Expenses | $1,424,000 | $344,000 | $214,000 | $1,982,000 |
Change in Net Assets
| Amount | |
|---|---|
| Total revenue | $2,323,000 |
| Total expenses | $1,982,000 |
| Change in net assets | $341,000 |
| Net assets, beginning of year | $890,000 |
| Net assets, end of year | $1,231,000 |
Ratios From This Example
| Metric | Calculation | Result |
|---|---|---|
| Program expense ratio | $1,424,000 ÷ $1,982,000 | 71.8% |
| Management and general ratio | $344,000 ÷ $1,982,000 | 17.4% |
| Fundraising ratio | $214,000 ÷ $1,982,000 | 10.8% |
| Cost to raise a dollar | $214,000 ÷ $940,000 contributions | $0.23 |
The 71.8% program ratio meets the BBB Wise Giving Alliance's 65% threshold and is within the range most donors consider acceptable. The combined M&G plus fundraising (28.2%) is well under BBB's implied 35% cap. To see how these expenses translate to net assets, review a nonprofit balance sheet example alongside this statement.
The Benchmarks That Actually Matter
Program expense ratio is the metric most donors and grantmakers check first. The BBB Wise Giving Alliance requires a minimum of 65% of total expenses going to program activities. Most sophisticated donors expect 70–75%. Charity Navigator has historically viewed 75%+ favorably.
That said, the overhead ratio has limitations as a standalone metric. In 2013, Charity Navigator, Candid (GuideStar), and BBB Wise Giving Alliance jointly published a letter acknowledging that low overhead ratios can harm organizations by starving them of necessary infrastructure — a problem researchers have called the "nonprofit starvation cycle." An organization that spends nothing on management and infrastructure is not better run; it's often running on fumes.
Operating reserve — unrestricted net assets available divided by monthly operating expenses — measures financial cushion. Three to six months of reserves is the commonly cited healthy range. Under one month is financially precarious; most major grantmakers want to see at least one to two months before making a multi-year grant.
Revenue concentration — if 70% of revenue comes from a single government contract or one foundation grant, that's a structural vulnerability most experienced funders will note. Diversification isn't about chasing dollars; it's about organizational resilience. Check how revenue concentration affects your monthly cash position with the nonprofit cash flow calculator.
What Goes on Form 990
The statement of activities is the foundation for IRS Form 990, which every public charity with over $200,000 in gross receipts must file. Form 990 is public record — searchable on ProPublica's Nonprofit Explorer and Candid's database. That means your revenue, expenses, executive compensation, and program descriptions are visible to any donor or funder who wants to see them.
Part VIII covers revenue. Part IX covers the functional expense breakdown — the same 26 expense lines (salaries, benefits, professional fees, occupancy, etc.) allocated across program, M&G, and fundraising. Part X is the balance sheet.
Boards are expected to review the Form 990 before it's filed. If your board members aren't reviewing the 990 annually, that's a governance gap.
How to Use the Statement Each Year
A statement of activities reviewed once a year is a compliance document. Reviewed quarterly against budget, it becomes a management tool.
The review process:
- Calculate the program expense ratio and compare to prior year — is the ratio improving, holding, or eroding?
- Check restricted net assets — how much donor-restricted revenue came in, and how much was released? Are restricted balances growing faster than you can deploy them?
- Review operating reserve — did net assets increase or decrease? Is the reserve trend moving in the right direction?
- Investigate any functional expense line that shifted significantly — if M&G costs rose 20% without a corresponding increase in organizational capacity, find out why
The Nonprofit Income Statement Template is built for this workflow — with the two-column net asset structure, functional expense allocation, and year-over-year comparison built in.
Related Documents
The statement of activities is one of four required nonprofit financial statements. The others:
- Statement of Financial Position (balance sheet) — assets, liabilities, and net assets at a point in time. Shows what you own and what you owe. A nonprofit budget connects the planning side to these actual results.
- Statement of Cash Flows — where cash came from and where it went, separate from accrual revenue recognition
- Statement of Functional Expenses — the full matrix of natural expenses across program, M&G, and fundraising (required for voluntary health and welfare organizations; recommended for all)
The statement of activities tells you whether revenue exceeded expenses and whether net assets grew. The statement of financial position tells you whether the organization is financially stable. Both matter — a nonprofit can show a positive change in net assets while holding dangerous amounts of restricted-only funds with little unrestricted liquidity.
If you're also managing the budget planning side, the Nonprofit Budget Template complements the income statement with budget-vs-actual tracking across the same functional categories.
Last updated: March 23, 2026
Frequently Asked Questions
Related Articles
Coffee Shop Income Statement Example: Revenue, Costs, and Margins
A coffee shop income statement example with beverage cost benchmarks, labor targets, prime cost rules, and a worked P&L for an independent café doing $480K/year.
Daycare Income Statement Example: Revenue, Costs, and Margins
A daycare income statement example with tuition revenue, CACFP reimbursements, staff cost benchmarks, and a worked P&L for a 50-child childcare center.
Food Truck Income Statement Example: Line Items and Benchmarks
A food truck income statement example with food cost benchmarks, unique line items like commissary and pitch fees, and a worked P&L for a single-truck operation.
Healthcare Income Statement Example: Revenue, Expenses, and Margins
A healthcare income statement example covering net patient revenue, contractual adjustments, expense benchmarks, and operating margin targets for providers.
Healthcare Pro Forma Example: What to Include and How to Build One
A practical healthcare pro forma example — covering revenue projections, payer mix, expense benchmarks, and a worked model for a new medical practice or service line.
Hotel Pro Forma Example: What to Include and How to Build One
A practical hotel pro forma example — covering RevPAR, GOP, undistributed expenses, FF&E reserves, and a worked model for acquisition or development underwriting.