Restaurant Pro Forma Example: What to Include and How to Build One
A practical restaurant pro forma example — covering sections, cost benchmarks, and a worked Year 1 projection for a full-service concept seeking SBA financing.
A restaurant pro forma is the financial model you build before anything is real — before the lease is signed, the loan is approved, or the first cover is served. It answers a single question: if my assumptions are right, does this concept work financially?
If you're opening a new location, applying for an SBA loan, or pitching to investors, you need one. This post walks through what a pro forma includes, the benchmarks to use as inputs, and a worked Year 1 example for a full-service restaurant.
Pro Forma vs. P&L: Not the Same Document
The terms get confused constantly. Here's the distinction:
| Pro Forma | P&L / Income Statement | |
|---|---|---|
| Time orientation | Future projections | Historical actuals |
| Data basis | Assumptions | Recorded transactions |
| Primary use | Planning, fundraising | Reporting, tax filing |
| GAAP required | No | Yes (for audited statements) |
Your monthly P&L shows what happened. Your pro forma shows what should happen if your plan holds. Lenders and investors want both — the P&L to assess your track record, the pro forma to assess your plan.
For a brand-new restaurant with no operating history, the pro forma does even more work. It's the primary document that justifies the entire investment.
When You Need a Restaurant Pro Forma
SBA loan applications. The Small Business Administration requires multi-year financial projections as part of any loan package. Lenders calculate your debt service coverage ratio (DSCR) — projected operating income divided by annual loan payments. A DSCR below 1.25x tells the lender you won't comfortably service the debt.
Investor or partner pitches. Anyone considering putting capital into your restaurant wants to see projected returns: cash-on-cash return, payback period, and what happens in a downside scenario. A pro forma with base, upside, and downside cases signals you understand the risks. Present your pro forma to investors with Deckary.
Evaluating a new location before signing a lease. The most important use of a pro forma — and the one most operators skip. Before committing to a lease, use the restaurant break-even calculator to determine the minimum revenue required at that rent level, then model whether the unit economics work given that specific rent, market, and concept. If the numbers only work in the upside scenario, that's a signal worth understanding before signing a 10-year lease.
Opening a second or third location. Multi-unit operators use per-unit pro formas to compare sites and standardize expectations across the portfolio.
Negotiating lease terms. Your pro forma tells you the maximum rent you can afford while keeping occupancy cost within 6–10% of projected sales. That's your negotiating ceiling.
What a Restaurant Pro Forma Includes
A complete restaurant pro forma has five main components:
1. Revenue Projections
Break revenue out by type from the start. Food and beverage have different cost structures, so lumping them together creates accounting problems later.
- Food sales (dine-in and takeout)
- Alcohol and beverage sales
- Delivery revenue (record net of platform fees, or gross with fees as a separate expense line)
- Catering and private events
- Other (merchandise, classes, gift card revenue)
Revenue projections should reflect a ramp period. Most new restaurants run at 50–70% of steady-state capacity in months 1–3 as word-of-mouth builds and operations stabilize.
2. Cost of Goods Sold (COGS)
- Food cost (target: 28–35% of food sales)
- Non-alcoholic beverage cost
- Alcohol cost (liquor: 18–20%; draft beer: 15–18%; wine: 35–45%)
According to the National Restaurant Association's 2025 Operations Data Abstract — based on data from over 900 operators covering 2024 — the median food and non-alcohol beverage cost was 32.0% for full-service restaurants and 32.4% for limited-service. Use these as starting benchmarks, then adjust for your menu and concept.
3. Labor Costs
Labor is the single biggest variable in whether a restaurant concept works financially.
- Front-of-house wages (servers, bartenders, hosts, bussers)
- Back-of-house wages (cooks, prep, dishwashers)
- Management salaries
- Payroll taxes (budget 10–12% on top of gross wages)
- Benefits (health insurance, paid leave if applicable)
The NRA's 2024 data shows the gap between profitable and unprofitable full-service operators almost entirely comes down to labor: 34.2% of sales for profitable operators versus 42.9% for unprofitable ones. An 8.7-point difference on a $1.5M restaurant is over $130,000 per year.
Prime cost — COGS plus total labor — is the most closely watched number in restaurant finance. Target 60–65% of sales for full-service concepts. If your pro forma shows prime cost above 68%, the concept is unlikely to generate meaningful profit.
4. Operating Expenses
| Category | Typical Range (% of sales) |
|---|---|
| Occupancy (rent, CAM, property taxes) | 6–10% |
| Utilities (electric, gas, water) | 2–5% |
| Marketing and advertising | 2–5% |
| Credit card processing fees | 2–4% |
| Insurance (liability, property, liquor) | 1–3% |
| Technology (POS, reservations, scheduling) | 1–2% |
| Repairs and maintenance | 1–2% |
| Supplies and smallwares | 0.5–1% |
| Accounting, legal, and G&A | 0.5–1% |
| Licenses and permits | 0.5% |
Occupancy deserves special attention in a new-location pro forma. A site at 12–15% of projected sales is very difficult to make profitable — fixed costs absorb too much of every revenue dollar. Your pro forma should establish the maximum monthly rent that keeps occupancy within range.
5. Startup Costs (For New Openings)
A new-opening pro forma needs a separate startup section:
- Leasehold improvements and build-out
- Kitchen equipment (purchase or lease)
- Furniture, fixtures, and equipment (FF&E)
- Pre-opening labor and training
- Initial food and beverage inventory
- Deposits (lease, utilities)
- Licensing and permits
- Working capital reserve
Average restaurant startup cost runs approximately $275,000 for a leased building ($3,046 per seat). With owned real estate, expect $425,000 or more. Ghost kitchens and food trucks can open for $50,000–$100,000. For a detailed line-by-line breakdown of these costs, see the restaurant startup costs example.
Worked Example: Year 1 Pro Forma, Full-Service Restaurant
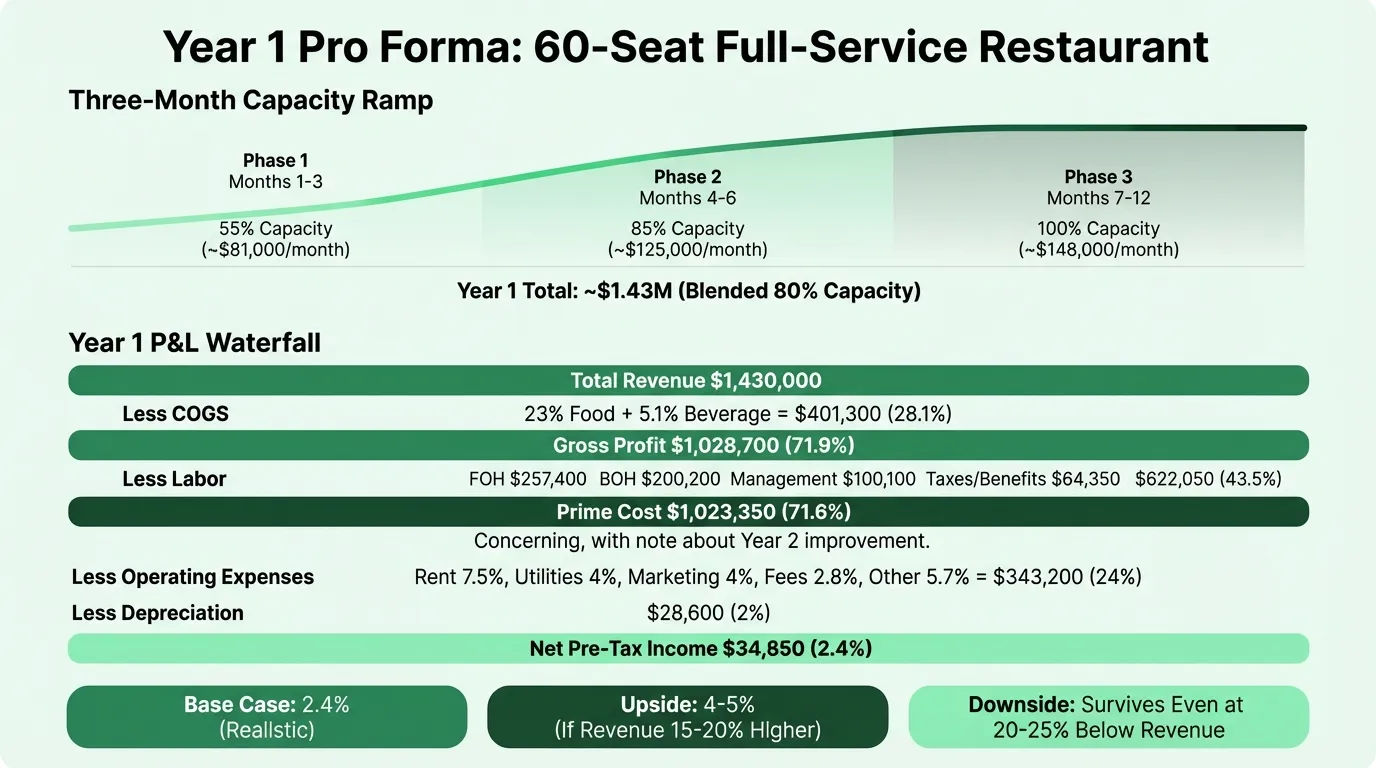
This example is for a new 60-seat full-service restaurant in its first operating year, with a 3-month ramp period.
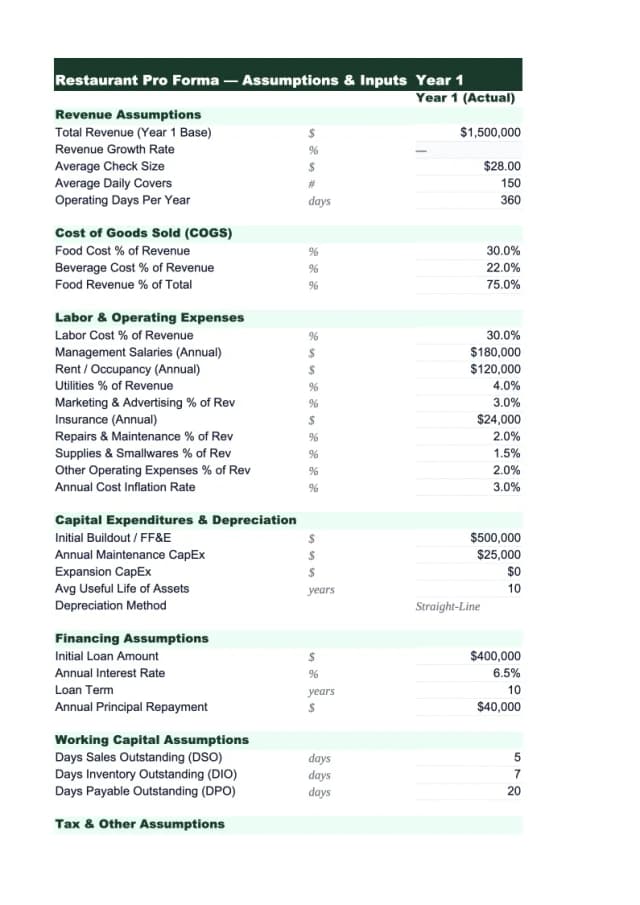
Revenue Assumptions
- 60 seats × 1.5 average turns × $55 average check
- 300 operating days per year
- Ramp period: 55% capacity months 1–3, 85% months 4–6, 100% months 7–12
- Revenue mix: 72% food, 23% alcohol, 5% catering
| Period | Monthly Revenue | Notes |
|---|---|---|
| Months 1–3 | ~$81,000 | Ramp period (55% capacity) |
| Months 4–6 | ~$125,000 | Stabilizing (85% capacity) |
| Months 7–12 | ~$148,000 | Full capacity |
| Year 1 Total | ~$1,430,000 | Blended effective capacity ~80% |
Year 1 Pro Forma Summary
| Category | Annual | % of Sales |
|---|---|---|
| Total Revenue | $1,430,000 | 100% |
| Food cost (32% of food sales) | $328,900 | 23.0% |
| Beverage cost (22% of beverage sales) | $72,400 | 5.1% |
| Total COGS | $401,300 | 28.1% |
| Gross Profit | $1,028,700 | 71.9% |
| FOH wages (servers, bar, host) | $257,400 | 18.0% |
| BOH wages (kitchen) | $200,200 | 14.0% |
| Management salaries | $100,100 | 7.0% |
| Payroll taxes and benefits | $64,350 | 4.5% |
| Total Labor | $622,050 | 43.5% |
| Prime Cost | $1,023,350 | 71.6% |
| Rent | $107,250 | 7.5% |
| Utilities | $57,200 | 4.0% |
| Marketing | $57,200 | 4.0% |
| Credit card processing (2.8%) | $40,040 | 2.8% |
| Insurance | $28,600 | 2.0% |
| Repairs and maintenance | $17,160 | 1.2% |
| Technology | $14,300 | 1.0% |
| Supplies | $11,440 | 0.8% |
| Accounting and legal | $10,010 | 0.7% |
| Total Operating Expenses | $343,200 | 24.0% |
| Depreciation | $28,600 | 2.0% |
| Total Expenses | $1,395,150 | 97.6% |
| Net Pre-Tax Income | $34,850 | 2.4% |
Year 1 comes in at 2.4% — below the NRA's full-service median of 2.8% for all operators, which is expected given the ramp period suppressing Year 1 revenue. Once the restaurant reaches steady-state operation in Year 2 (full $1.79M annualized run rate), the same cost structure yields 4–5% net margin.
The labor line (43.5%) is the main area to watch. That's elevated above the NRA's profitable-operator benchmark of 34.2% — but it reflects the reality of maintaining full staffing during a slow ramp period. Once revenue reaches steady-state, labor as a percentage of sales improves automatically without cutting headcount.
Need a ready-made pro forma template for your restaurant?
Download a pre-built spreadsheet with industry-specific categories, formulas, and formatting.
Building Your Revenue Projection
The revenue projection is where most pro formas go wrong. Operators often start with a target revenue figure and work backward, rather than building up from what the physical space can realistically produce.
The correct approach:
- Start with seat count. How many seats will the restaurant actually have?
- Estimate covers per seat per day. A full-service restaurant with lunch and dinner service might average 1.5–2.0 turns. A dinner-only concept: 1.0–1.5 turns.
- Establish average check per cover. This should come from your actual menu pricing, not industry averages.
- Multiply by operating days. Most full-service restaurants operate 300–350 days per year.
- Apply a ramp curve. New restaurants rarely hit steady-state in month one. Build in 3–6 months at reduced capacity.
This bottom-up approach produces a number you can defend. The restaurant sales forecast example walks through this formula in detail, including day-part segmentation and seasonal adjustments. A lender or investor will ask how you arrived at your revenue projection — "industry benchmarks suggest restaurants in this category average X" is a much weaker answer than "our 60-seat dining room at 1.5 turns and a $55 check produces $148,000 per month at full operation."
The Three Scenarios
A single-point forecast isn't enough for serious planning. Build three scenarios:
Base case. Your most realistic expectation — what you'd bet on. Use conservative assumptions for covers and occupancy cost, realistic benchmarks for food and labor.
Upside case. If revenue runs 15–20% above base and you manage labor tightly, what does the model show? This represents the case you're working toward.
Downside case. If revenue comes in 20–25% below base (a realistic possibility in Year 1), are you still able to service debt and cover fixed costs? If the downside scenario produces negative cash flow that depletes reserves within 6 months, that's a structural problem with the concept, not just a bad scenario.
Lenders use the downside scenario to assess risk. Investors use the upside scenario to assess opportunity. You should use all three to stress-test the plan.
Using the Pro Forma After Opening
A pre-opening pro forma becomes the benchmark for your actual performance. Each month, compare your P&L against the pro forma assumptions:
- Is revenue tracking the ramp curve you projected?
- Is food cost running at or below the projected percentage?
- Is labor holding within the target range?
- Is prime cost tracking toward 60–65%?
When actuals diverge from projections, the pro forma tells you where to investigate. If food cost is 4 points above projection in month two, that's a specific operational problem — portion control, waste, supplier prices — not just "the numbers are off."
The Restaurant Pro Forma Template is built for this ongoing use: Year 1 monthly detail with actual vs. projected variance tracking, plus Years 2–3 annual projections with scenario modeling.
For the historical reporting side, the Restaurant Income Statement Template covers monthly P&L tracking with NRA benchmark comparisons. The two documents work together — the pro forma sets the plan, the income statement measures performance against it.
What Makes a Pro Forma Credible
Lenders and investors have seen hundreds of restaurant pro formas. The ones that get funded share a few characteristics:
Assumptions are explicit. Don't just show the numbers — show how you arrived at them. Seat count, turn rate, average check, operating days. If your revenue projection is defensible, say so in the assumptions section.
Ramp period is realistic. Pro formas that show full capacity revenue from day one are instantly suspect. A 3–6 month ramp that reflects genuine operational learning signals credibility.
Labor is fully loaded. Many operators understate labor by excluding payroll taxes (add 10–12%) and benefits. Lenders who see a labor figure that excludes employer taxes know the projections are optimistic.
Sensitivity analysis is included. What happens if food costs run 2 points higher than projected? What if revenue is 15% below base in Year 1? Showing these scenarios demonstrates you've stress-tested the plan.
The downside scenario still works. Not necessarily profitably — but survivably. A downside scenario where you run out of cash in month four tells a different story than one where you hit breakeven a month later than planned.
Last updated: March 23, 2026
Frequently Asked Questions
Related Articles
Coffee Shop Income Statement Example: Revenue, Costs, and Margins
A coffee shop income statement example with beverage cost benchmarks, labor targets, prime cost rules, and a worked P&L for an independent café doing $480K/year.
Daycare Income Statement Example: Revenue, Costs, and Margins
A daycare income statement example with tuition revenue, CACFP reimbursements, staff cost benchmarks, and a worked P&L for a 50-child childcare center.
Food Truck Income Statement Example: Line Items and Benchmarks
A food truck income statement example with food cost benchmarks, unique line items like commissary and pitch fees, and a worked P&L for a single-truck operation.
Healthcare Income Statement Example: Revenue, Expenses, and Margins
A healthcare income statement example covering net patient revenue, contractual adjustments, expense benchmarks, and operating margin targets for providers.
Healthcare Pro Forma Example: What to Include and How to Build One
A practical healthcare pro forma example — covering revenue projections, payer mix, expense benchmarks, and a worked model for a new medical practice or service line.
Hotel Pro Forma Example: What to Include and How to Build One
A practical hotel pro forma example — covering RevPAR, GOP, undistributed expenses, FF&E reserves, and a worked model for acquisition or development underwriting.