Restaurant Pro Forma Template
Project a restaurant's revenue, food cost, labor, and net income across 5 years — with pre-built formulas for cover counts, average check, COGS, and break-even analysis.
What's Inside This Restaurant Pro Forma Template
This template includes 6 worksheets, each designed for a specific part of your restaurant financial workflow:
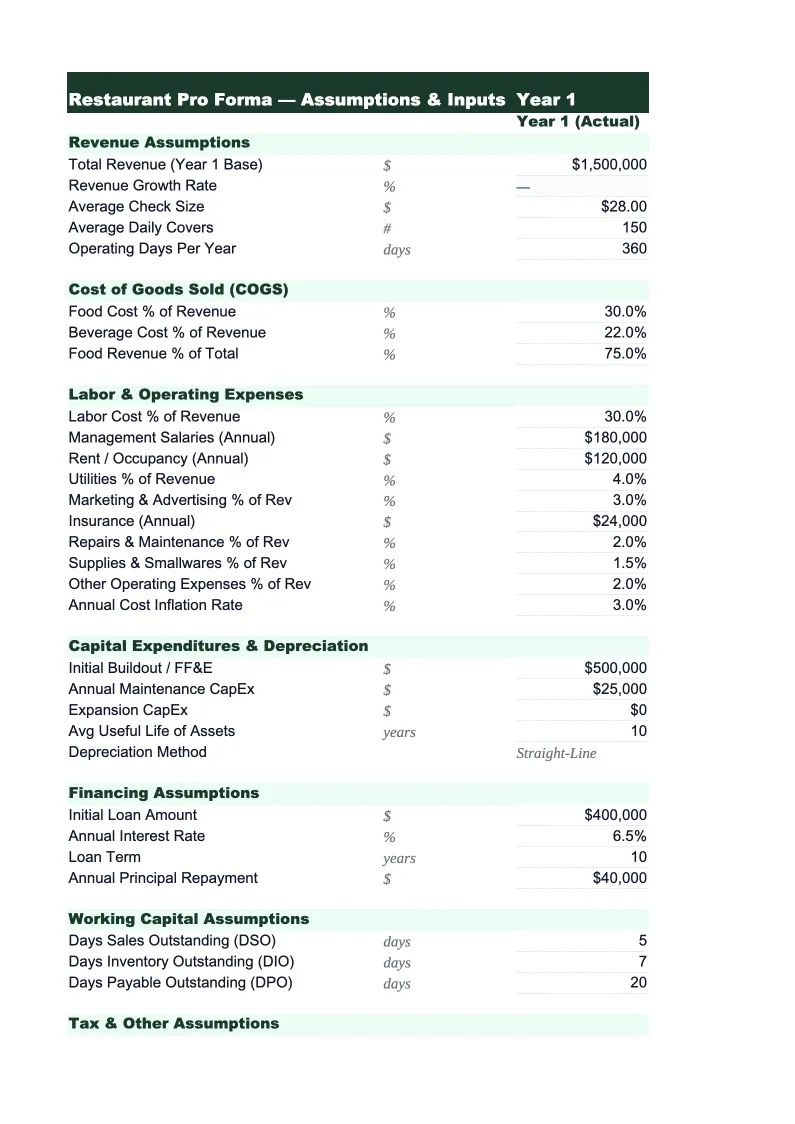
Assumptions
The control panel for the entire model.
Revenue Projections
Projects total restaurant revenue by month for year one and annually through year five.
Operating Expenses
Breaks out all restaurant operating costs following the standard food service chart of accounts.
Startup Costs
A dedicated worksheet for estimating the total investment required to open or remodel a restaurant.
5-Year P&L Summary
An annual summary showing total revenue, COGS, gross profit, total labor, total occupancy, total operating expenses, EBITDA, and net income for each of the five projected years side by side.
Break-Even Analysis
Calculates the monthly revenue and daily cover count your restaurant needs to cover all fixed and variable costs.
Restaurant Pro Forma Template Features
- Cover count and average check model with ramp-up schedule for new openings
- COGS split by food and beverage with industry-benchmark percentage targets
- Labor model with FOH, BOH, and management tracked separately as % of revenue
- Startup costs tracker with budgeted vs. actual columns for buildout and equipment
- 5-year annual P&L summary with EBITDA and net margin by year
- Break-even analysis by monthly revenue and daily cover count
How to Use This Restaurant Pro Forma Spreadsheet
Start with the Assumptions sheet. Enter your seating capacity, turns per day, and average check size — these three inputs drive most of the revenue model. If you're opening a new restaurant, set a realistic ramp schedule: most new restaurants operate at 40–60% of their target cover count for the first three to six months as they build the customer base and work out operational issues. Getting these assumptions right before looking at any outputs takes about 30 minutes and is the most important work you'll do with this template.
Once assumptions are in, review the Revenue Projections and Operating Expenses sheets to make sure the categories match your concept. A fast-casual counter-service operation has a fundamentally different cost structure than a full-service restaurant — toggle off revenue lines that don't apply and adjust the labor ratios to reflect how your specific concept is staffed. Use the Startup Costs sheet to compile your buildout and equipment estimates as bids come in; the total investment figure there feeds the break-even math automatically.
From download to lender-ready projections in under an hour
Enter your seating, covers, and average check — the model builds your 5-year revenue, COGS, labor, and break-even analysis automatically.
Why Every Restaurant Opening Needs a Pro Forma
A restaurant pro forma serves two different audiences, and getting it right matters for both. For lenders — especially SBA 7(a) lenders — the pro forma is a required document that shows you understand your unit economics. They want to see realistic food cost and labor percentages, a plausible ramp schedule, and a clear path to debt service coverage. For investors or equity partners, the pro forma needs to show the upside: what the concept looks like at maturity, what the return on invested capital is, and how long the payback period is. A spreadsheet that's too optimistic loses credibility with both audiences.
The three numbers that define restaurant financial health are food cost percentage (28–35% of food revenue for most concepts), total labor cost percentage (30–35% of total revenue including management and benefits), and occupancy cost percentage (ideally under 10% of revenue, though this is difficult in high-rent urban markets). A restaurant that controls all three can operate at 10–20% EBITDA margins even in a competitive market. A restaurant where food cost runs at 38% and labor runs at 38% is structurally unprofitable regardless of how good the food is — and a pro forma built before opening is the time to discover that, not six months in.
Restaurant Industry at a Glance
Financial templates built for restaurants — from fast-casual to fine dining. Pre-loaded with food cost categories, labor splits, and industry-standard KPIs.
Revenue Drivers
- Dine-in sales
- Takeout & delivery
- Catering
- Alcohol sales
Key Cost Categories
- Food costs (COGS)
- Labor
- Rent & occupancy
- Utilities
- Marketing
- Equipment & maintenance
Typical Margins
Gross: 60-70% · Net: 3-9%
Seasonality
Higher revenue in summer and holiday seasons; January-February typically slowest months.
Key Performance Indicators
Restaurant Pro Forma Template FAQ
More Restaurant Templates
Restaurant Balance Sheet Template for Excel
$29
Restaurant Budget Template for Excel
$29
Restaurant Business Plan Template for Excel
$39
Restaurant Cash Flow Template for Excel
$29
Restaurant Expense Tracker Template for Excel
$29
Restaurant Financial Model Template for Excel
$29
Restaurant Income Statement Template for Excel
$29
Restaurant Invoice Template for Excel
$29
Restaurant KPI Dashboard Template for Excel
$29
Restaurant P&L Template for Excel
$29
Restaurant Project Budget Template for Excel
$29
Restaurant Sales Forecast Template for Excel
$29
Restaurant Valuation Template for Excel
$29
Restaurant Pro Forma Template
$29