SaaS Balance Sheet Example: A Line-by-Line Breakdown
A complete SaaS balance sheet example with real line items, deferred revenue explained, and what makes software company financials different from every other industry.
The defining feature of a SaaS balance sheet isn't cash, isn't equity, and isn't debt. It's deferred revenue.
When a customer pays $12,000 upfront for an annual subscription, that money hits your bank account immediately. But on the balance sheet, it appears as a liability — an obligation you owe in the form of 12 months of software service. This is fundamentally different from how most businesses operate, and it explains why SaaS balance sheets look so different from retail stores, restaurants, or manufacturing companies.
Understanding the SaaS balance sheet means understanding a few accounting rules that don't apply elsewhere: deferred revenue recognition, capitalized software development costs, capitalized sales commissions, and an equity section that often shows a large accumulated deficit for years before a company turns profitable.
This post walks through each line item with a complete example.
What Makes SaaS Different on a Balance Sheet
Every balance sheet has the same three sections — assets, liabilities, equity — and the same fundamental equation: Assets = Liabilities + Equity. But the composition of those sections looks almost nothing like other industries.
Almost no physical assets. A manufacturing company might have millions in equipment and facilities. A retailer's largest asset is merchandise inventory. SaaS companies own almost nothing physical — no factories, no inventory, minimal hardware. The largest "assets" are intangible: software, customer relationships, and cash.
Deferred revenue dominates the liabilities side. For a SaaS company billing customers annually, deferred revenue is almost always the largest single liability. A company with $3M in ARR and most customers on annual plans might carry $1.4M in deferred revenue — money collected but not yet earned. This is structurally different from, say, a restaurant, where revenue is recognized the moment food is served.
Cash is the primary current asset. SaaS companies don't carry inventory and often have minimal accounts receivable (especially for self-serve products with automated billing). Cash is king, and managing runway — how many months of operations cash can fund — is the primary financial concern for early and growth-stage companies. For the full set of accounting rules that govern how these numbers are recorded, see our SaaS accounting best practices guide.
Accumulated deficit is normal. Most VC-backed SaaS companies show an accumulated deficit in their equity section for years, often until reaching $20M+ ARR. This doesn't mean the company is in trouble. It means cumulative historical investment in growth has exceeded cumulative historical profits. The question for investors and lenders isn't whether a deficit exists — it's whether the company has cash, growing ARR, and a credible path to unit economics that work.
The Three Sections: What Goes Where
Assets
Current assets — convertible to cash within 12 months:
- Cash and cash equivalents — The most important number on the balance sheet for early and growth-stage SaaS. Includes operating accounts and short-term deposits. For VC-backed companies, this typically includes the proceeds of recent fundraising rounds.
- Accounts receivable (net) — Invoices issued but not yet collected. For companies with monthly auto-billing, this is minimal. For enterprise SaaS billing net-30 or net-60, AR grows with the enterprise customer base.
- Deferred contract acquisition costs (current) — The portion of capitalized sales commissions expected to amortize within the next 12 months. Under ASC 340-40, commissions on multi-year contracts must be capitalized and amortized rather than expensed upfront.
- Prepaid expenses — Prepaid SaaS tools, insurance, and rent are common for a software business.
Non-current assets — owned assets that won't convert to cash within 12 months:
- Capitalized software development costs (net) — Under ASC 350-40, only costs in the "application development stage" — coding, testing, and preparing software for its intended use — can be capitalized. Preliminary feasibility work and post-launch bug fixes must be expensed as incurred. Capitalized costs are amortized over 3–5 years and typically flow through COGS or R&D. This line grows as the product is built out.
- Deferred contract acquisition costs (long-term) — The portion of capitalized commissions attributable to periods beyond 12 months.
- Property and equipment (net) — Computers, servers, and office equipment. Minimal by design — SaaS companies run on cloud infrastructure (AWS, Azure, GCP), which is expensed as COGS, not owned as an asset.
- Right-of-use asset — The capitalized value of any operating lease longer than 12 months, required under ASC 842. For SaaS companies with office leases, this is typically the largest fixed asset.
- Goodwill and intangibles — Appears when a company makes acquisitions. The excess of purchase price over the fair value of identifiable assets becomes goodwill. Acquired technology, customer relationships, and non-competes are recorded as intangible assets. For acquisitive companies, goodwill can dwarf everything else on the balance sheet.
Liabilities
Current liabilities — due within 12 months:
- Accounts payable — Outstanding vendor invoices. Typically small for SaaS companies relative to revenue.
- Accrued compensation — Payroll earned but not yet paid, plus accrued bonuses and commissions payable. Often one of the larger current liabilities for teams with significant headcount.
- Deferred revenue (current) — The portion of prepaid subscriptions that will be recognized as revenue in the next 12 months. This is the signature line item of a SaaS balance sheet. A company with $3M ARR, mostly on annual plans, might carry $1.2M here.
- Current portion of operating lease — Lease payments due within the next 12 months under ASC 842.
Non-current liabilities:
- Deferred revenue (long-term) — Prepaid subscriptions on contracts extending beyond 12 months. Multi-year enterprise deals create long-term deferred revenue. This line grows as the enterprise customer base scales.
- Venture debt — Term loans, convertible notes, or revenue-based financing. Each facility should be shown separately. Venture debt typically appears at growth stage as companies seek non-dilutive capital between equity rounds.
- Operating lease liability (long-term) — The non-current portion of lease obligations under ASC 842.
Equity
- Preferred stock — For VC-backed companies, each fundraising round creates a new class of preferred stock (Seed, Series A, Series B, etc.) with its own liquidation preferences. These must be broken out separately.
- Common stock and additional paid-in capital (APIC) — The par value and above-par proceeds from issuing common stock, including stock option exercises.
- Accumulated deficit — The running total of all net losses minus all net profits since the company was founded. Most venture-backed SaaS companies show a large negative number here for many years. A company that has raised $6M in equity and spent $7.5M over its lifetime shows an accumulated deficit of roughly $1.5M — this is entirely normal and expected.
Complete Example: Growth-Stage SaaS Company
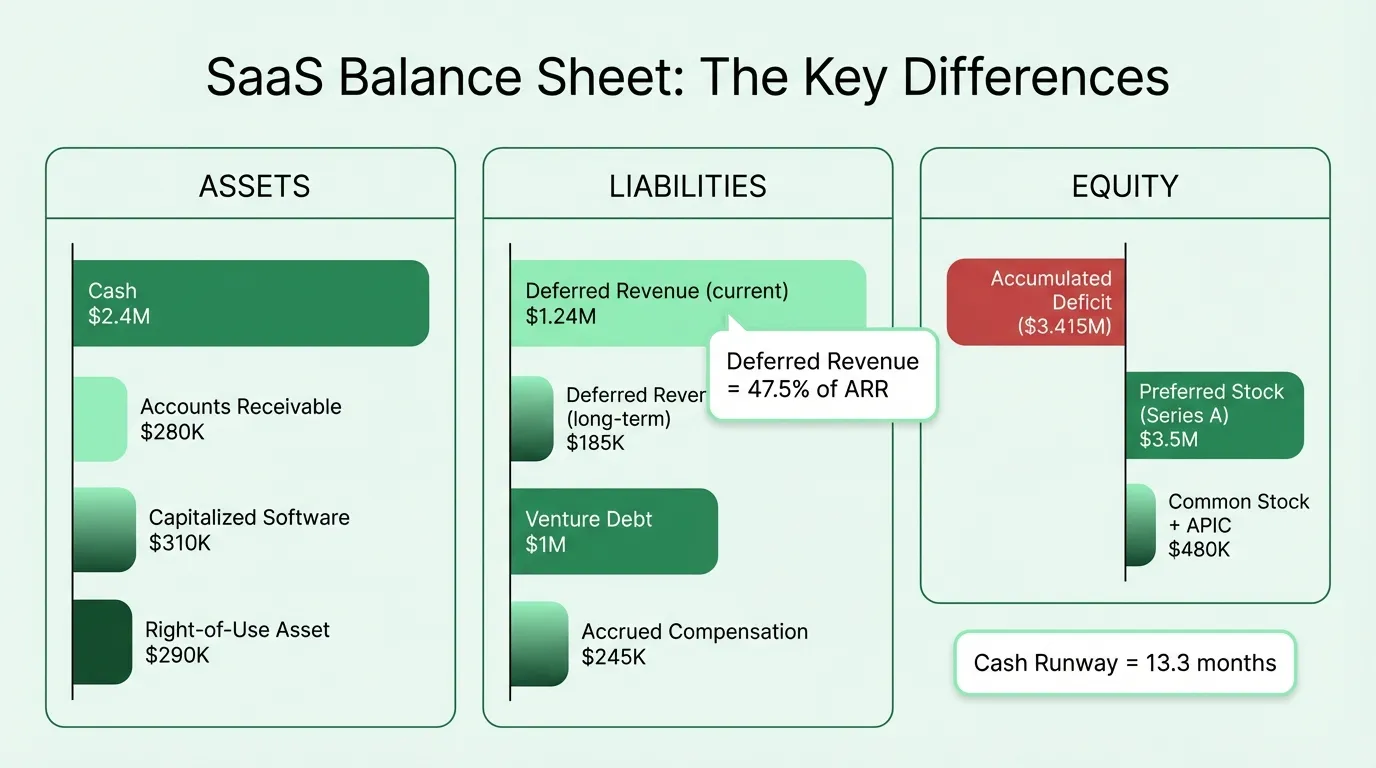
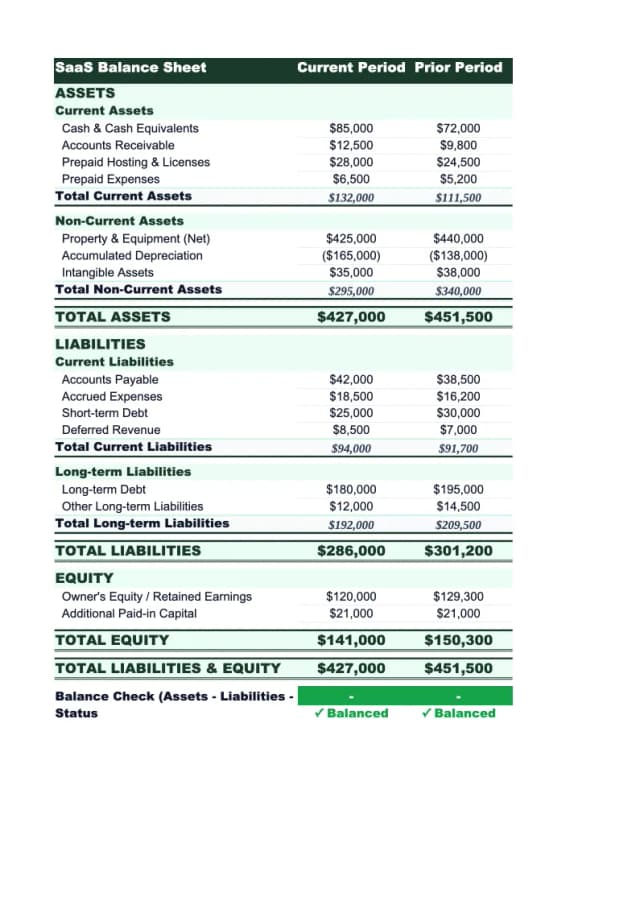
Here's a representative balance sheet for a private SaaS company with approximately $3M ARR, mostly annual billing, Series A funded:
Assets
Current Assets
| Line Item | Amount |
|---|---|
| Cash and cash equivalents | $2,400,000 |
| Accounts receivable, net | $280,000 |
| Deferred contract acquisition costs (current) | $65,000 |
| Prepaid expenses | $55,000 |
| Total Current Assets | $2,800,000 |
Non-Current Assets
| Line Item | Amount |
|---|---|
| Capitalized software development costs, net | $310,000 |
| Deferred contract acquisition costs (long-term) | $175,000 |
| Computer equipment and hardware, net | $45,000 |
| Right-of-use asset (office lease) | $290,000 |
| Total Non-Current Assets | $820,000 |
Total Assets: $3,620,000
Liabilities
Current Liabilities
| Line Item | Amount |
|---|---|
| Accounts payable | $95,000 |
| Accrued compensation | $245,000 |
| Deferred revenue (current) | $1,240,000 |
| Current portion of operating lease | $72,000 |
| Total Current Liabilities | $1,652,000 |
Non-Current Liabilities
| Line Item | Amount |
|---|---|
| Deferred revenue (long-term) | $185,000 |
| Venture debt | $1,000,000 |
| Operating lease liability (long-term) | $218,000 |
| Total Non-Current Liabilities | $1,403,000 |
Total Liabilities: $3,055,000
Equity
| Line Item | Amount |
|---|---|
| Preferred stock (Series A) | $3,500,000 |
| Common stock and APIC | $480,000 |
| Accumulated deficit | ($3,415,000) |
| Total Equity | $565,000 |
Total Liabilities + Equity: $3,620,000
Key Ratios for SaaS
Current Ratio
Current Ratio = Current Assets / Current Liabilities
In this example: $2,800,000 / $1,652,000 = 1.70
The target range for SaaS companies is 1.5–2.0. A ratio below 1.0 means current liabilities exceed current assets — a genuine liquidity concern. The 1.70 here is healthy. Note that SaaS doesn't have inventory, so the quick ratio (which strips out inventory) is essentially the same as the current ratio. Verify how your subscription gross margin feeds into this picture with the SaaS profit margin calculator.
Deferred Revenue as a Percentage of ARR
In this example: ($1,240,000 + $185,000) / $3,000,000 = 47.5%
This ratio tells you how much revenue is pre-collected. A high percentage means more customers are on annual plans — which is positive for cash flow predictability but means revenue recognition lags behind cash collection. If this percentage is declining over time, it may indicate customers pushing for monthly billing, which reduces upfront cash collection.
Cash Runway
Runway = Cash / Monthly Burn
If this company is burning $180,000/month (net), their runway is $2,400,000 / $180,000 = 13.3 months. The 12–18 month runway benchmark is the standard for growth-stage SaaS companies. Running below 9 months triggers fundraising urgency. To understand how pricing decisions affect burn rate, see our SaaS pricing best practices.
Need a ready-made balance sheet template for your saas?
Download a pre-built spreadsheet with industry-specific categories, formulas, and formatting.
How the Balance Sheet Changes by Stage
The composition of a SaaS balance sheet shifts substantially as a company grows:
| Stage | Dominant Asset | Dominant Liability | Equity Situation |
|---|---|---|---|
| Early (pre-$1M ARR) | Cash from fundraise | Small deferred revenue; possible convertible notes | Large accumulated deficit; seed preferred stock |
| Growth ($1M–$10M ARR) | Cash + growing AR; capitalized commissions appear | Deferred revenue grows; venture debt possible | Multiple preferred stock series; deficit growing but controlled |
| Mature ($20M+ ARR) | Goodwill from acquisitions; large intangible base | Substantial deferred revenue; structured debt facilities | Accumulated deficit may flip to retained earnings as company approaches profitability |
The key shift happens around $5M–$10M ARR, when annual contracts with enterprise customers start making deferred revenue a significant balance sheet item, and when commissions on those contracts create meaningful capitalized commission assets.
What Investors and Lenders Look At
When a VC reviews a balance sheet or a bank evaluates a SaaS credit facility, they're looking at different things than they would for a traditional business:
| What They Check | What They Want to See |
|---|---|
| Cash runway | 12–18 months minimum; longer at higher ARR |
| Deferred revenue trend | Growing, which signals strong bookings |
| Burn multiple | Net new ARR / net cash burned; under 2.0x is healthy |
| Accumulated deficit | Accepted, but must be paired with ARR growth |
| Venture debt terms | Covenants tied to ARR milestones, not profitability |
| Goodwill impairment | None — impairment signals overpaid acquisition |
The relationship between deferred revenue and ARR is particularly important for lenders structuring recurring revenue loans. A SaaS company with $3M ARR and $1.4M in deferred revenue is demonstrating strong annual commitment from its customer base — that's pledgeable collateral in a way that monthly-billed ARR is not.
The Deferred Revenue Trap in Acquisitions
One balance sheet item that surprises SaaS founders going through M&A: deferred revenue gets written down to near zero at close.
When a company is acquired, the acquirer must record deferred revenue at its "fair value" — typically the cost to fulfill the remaining service obligation. That's almost always much lower than the face value of the liability. A $1.2M deferred revenue balance might be written down to $180,000 post-close. This means the acquirer reports lower revenue in the quarters following the acquisition, which can make post-acquisition financials look worse than they are.
If you're building toward an exit, this mechanic is worth understanding. It affects how an acquirer values your deferred revenue, and it affects the reported revenue trend in the combined entity after close.
Using the Balance Sheet as a Management Tool
Most SaaS founders track ARR, churn, and burn multiple closely. Fewer track the balance sheet monthly, which is where structural health issues surface before they become emergencies.
Check these monthly:
- Cash balance and runway — Is runway growing or shrinking? A declining runway with flat ARR growth is a signal to act.
- Deferred revenue trend — Growing = customers are committing to annual plans. Shrinking = customers are switching to monthly or churning.
- Accrued compensation — Is this growing faster than headcount? Unrecognized bonuses and commissions can create unexpected cash demands.
- Capitalized software balance — If this line is growing faster than you expect, verify that costs being capitalized meet the ASC 350-40 requirements. Over-capitalization inflates assets and defers expenses in ways that can come back as a restatement issue.
The SaaS Balance Sheet Template is structured for this monthly review with SaaS-specific line items and ratio calculations built in. For a complete financial picture, it works alongside the SaaS Income Statement Template — which covers ARR, revenue recognition, and operating metrics — giving you both the period performance and the point-in-time financial position. See our SaaS income statement example for a worked P&L with gross margin and Rule of 40 benchmarks.
Understanding your balance sheet doesn't require an accounting degree. It requires knowing which five or six numbers to watch, and what a shift in any of them means for your business.
Last updated: March 24, 2026
Frequently Asked Questions
Related Articles
Church Accounting Best Practices: A Practical Guide
How church accounting works — fund accounting, restricted funds, internal controls, financial reports, and the tax rules that catch churches off guard.
Church Balance Sheet Example: A Line-by-Line Breakdown
A complete church balance sheet example with real line items, fund accounting explained, and the benchmarks church boards use to assess financial health.
Construction Accounting: A Practical Guide for Contractors
Construction accounting is different from standard accounting. This guide covers job costing, WIP schedules, retainage, revenue recognition methods, and common mistakes.
Construction Balance Sheet Example: A Line-by-Line Breakdown
A complete construction company balance sheet example with real line items, WIP accounting, retainage, overbilling, and what sureties and lenders look for.
Daycare Balance Sheet Example: Line by Line
A complete daycare balance sheet example with real line items — enrollment deposits, playground equipment, subsidy receivables, and what the numbers mean.
Food Truck Balance Sheet Example: A Line-by-Line Breakdown
A complete food truck balance sheet example with real line items, truck depreciation rules, and what makes a food truck's financials different from a restaurant.