SaaS Income Statement Example: Line Items and Benchmarks
A SaaS income statement example with line items, gross margin benchmarks, and a worked P&L — covering deferred revenue, COGS, R&D, S&M, G&A, and the Rule of 40.
A SaaS income statement looks different from most other business P&Ls — not just because the numbers are different, but because the structure itself reflects how the business model works. Subscription revenue gets recognized over time, not when cash lands. COGS is driven by infrastructure and support, not inventory. And operating expenses are split into three buckets that investors treat as distinct signals.
Understanding that structure makes it possible to read any SaaS income statement — and benchmark your own.
Why SaaS Revenue Recognition Is Different
Most businesses record revenue when a sale is made. SaaS companies can't do that when customers pay annually upfront.
Under ASC 606, revenue must be recognized as performance obligations are satisfied — for a SaaS subscription, that means pro-rated over the subscription period. A customer who pays $24,000 for an annual contract on July 1 generates $2,000 of recognized revenue per month, not $24,000 on day one.
This creates deferred revenue: a balance sheet liability representing cash collected but not yet earned. On the income statement, this matters because:
- Monthly Recurring Revenue (MRR) and Annual Recurring Revenue (ARR) are the operational metrics management uses to track the business
- GAAP revenue is what appears on the income statement — revenue that has been earned through service delivery
- The two can diverge significantly during periods of rapid growth (more cash collected than earned) or contraction (more earned than collected)
When reading a SaaS income statement, revenue growth rates based on ARR and GAAP revenue can tell different stories. A company adding customers quickly might show strong ARR growth but lagging GAAP revenue growth because the ARR is building in deferred contracts. Our SaaS accounting best practices guide covers the ASC 606 framework that governs when this revenue can be recognized.
The SaaS Income Statement Structure
A standard SaaS income statement follows this structure:
Revenue
- Subscription revenue (recurring)
- Professional services / implementation revenue (non-recurring)
- Total revenue
Cost of Revenue (COGS)
- Hosting and infrastructure
- Customer support
- Implementation costs
- Payment processing
- Total COGS
Gross profit
Operating Expenses
- Research and Development (R&D)
- Sales and Marketing (S&M)
- General and Administrative (G&A)
- Total operating expenses
Operating income (loss)
Below operating income: interest income/expense, other income, income tax.
Net income (loss)
This structure is consistent across nearly all public SaaS companies — Salesforce, HubSpot, Shopify, Zendesk. The three-way split of operating expenses (R&D, S&M, G&A) is the standard, not a variation.
COGS: What Drives SaaS Gross Margin
SaaS COGS is fundamentally different from retail or manufacturing. There's no physical product — what you're paying for is the cost to deliver the software to customers.
Hosting and infrastructure — cloud compute, storage, and networking costs on AWS, GCP, or Azure. For a lean SaaS company, this is typically 8-15% of revenue. For AI-native products with high inference costs, it can be much higher — some AI-first SaaS companies run infrastructure costs at 30-40%+ of revenue, compressing gross margins to 50-60%.
Customer support — salaries and benefits for support staff, ticketing software, and knowledge base tools. This line scales with customer count and product complexity.
Implementation and onboarding — for enterprise SaaS with complex deployments, implementation costs are significant. For self-serve products, this may be near zero.
Payment processing — Stripe and similar processors typically charge 2.5-3% of revenue. At scale, this becomes material.
Third-party licenses — APIs or software components embedded in the product that are billed per customer or per usage.
The benchmark for SaaS COGS is 20-30% of revenue for traditional software products. Blossom Street Ventures, analyzing 63 public SaaS companies through 2024, found a median COGS of 26% of revenue.
Gross Margin Benchmarks
Gross margin is the most-watched line on a SaaS income statement. It signals how scalable the business model is — high gross margins mean each new dollar of revenue costs very little to deliver.
| Gross Margin | Interpretation |
|---|---|
| 80%+ | Excellent — pure software with minimal support overhead |
| 70-80% | Healthy — typical for well-run SaaS with support costs |
| 60-70% | Acceptable but under pressure — often services-heavy or AI-compute-heavy |
| Below 60% | Concerning — suggests high infrastructure costs or services dependency |
Companies with gross margins above 80% receive meaningfully higher valuation multiples than those below. The threshold investors watch most closely is 70%: dropping below it typically requires explanation. You can benchmark your own margins with the SaaS profit margin calculator.
For AI-native SaaS products, the benchmark is shifting. Model inference costs are compressing gross margins, and 60-70% has become more accepted for AI products — though investors still reward companies that manage to keep margins above 70%.
Need a ready-made income statement template for your saas?
Download a pre-built spreadsheet with industry-specific categories, formulas, and formatting.
Operating Expenses: The Three Buckets
Operating expenses in SaaS are divided into three categories that each tell a different story.
Research and Development (R&D)
R&D covers engineering salaries, product management, and technical infrastructure used to build and improve the product. For public SaaS companies, R&D typically runs 20-30% of revenue.
R&D as a percentage of revenue tends to decrease as companies scale — the same engineering team can support a larger revenue base once the core product is mature. Early-stage companies often invest 35-50% of revenue in R&D.
Sales and Marketing (S&M)
S&M covers the sales team (account executives, SDRs, sales management), marketing programs (content, paid acquisition, events, demand generation), and marketing tools. This is typically the largest operating expense line for growth-stage SaaS.
Blossom Street Ventures' 2024 analysis of public SaaS companies found S&M spending around 40-48% of revenue, with a trend toward lower spending as companies focused on profitability. Enterprise SaaS with long sales cycles and large deal sizes tends toward the higher end; product-led growth companies often run lower S&M ratios.
The efficiency question for S&M is the CAC payback period — how many months of gross profit it takes to recover the cost of acquiring a customer. Top-performing SaaS companies target under 12 months. Track and capitalize sales commissions with Carvd.
General and Administrative (G&A)
G&A covers finance, legal, HR, and executive overhead. For public SaaS, Blossom Street Ventures found G&A at approximately 20-21% of revenue in 2024 — meaningfully higher than many founders expect.
G&A as a percentage of revenue should decrease as companies scale. At $1M ARR, G&A at 25% is common. At $50M ARR, 10-15% is more typical. Companies that can't drive G&A below 20% at scale often have process or systems issues.
Operating Income and the Rule of 40
After subtracting operating expenses from gross profit, you get operating income (or operating loss). Most growth-stage SaaS companies run at an operating loss — they're investing in growth ahead of profitability.
The median operating loss for public SaaS companies was -9% of revenue in 2024, improved significantly from -15% in 2023 and -28% in 2022, according to Blossom Street Ventures' analysis of 63 public SaaS companies. The trend toward profitability has been sharp as capital costs rose.
The Rule of 40 is the framework investors use to evaluate the tradeoff between growth and profitability:
Rule of 40 Score = Revenue Growth Rate % + EBITDA Margin %
A score above 40 is considered healthy. A company growing at 35% with a -10% EBITDA margin scores 25 — below the threshold. A company growing at 20% with a 25% EBITDA margin scores 45 — healthy.
Both numbers come from the income statement. This is why investors don't evaluate SaaS P&Ls the same way they'd evaluate a manufacturing business: pure profitability isn't the goal. The growth/profitability trade-off is.
Worked Example: Mid-Market B2B SaaS Company
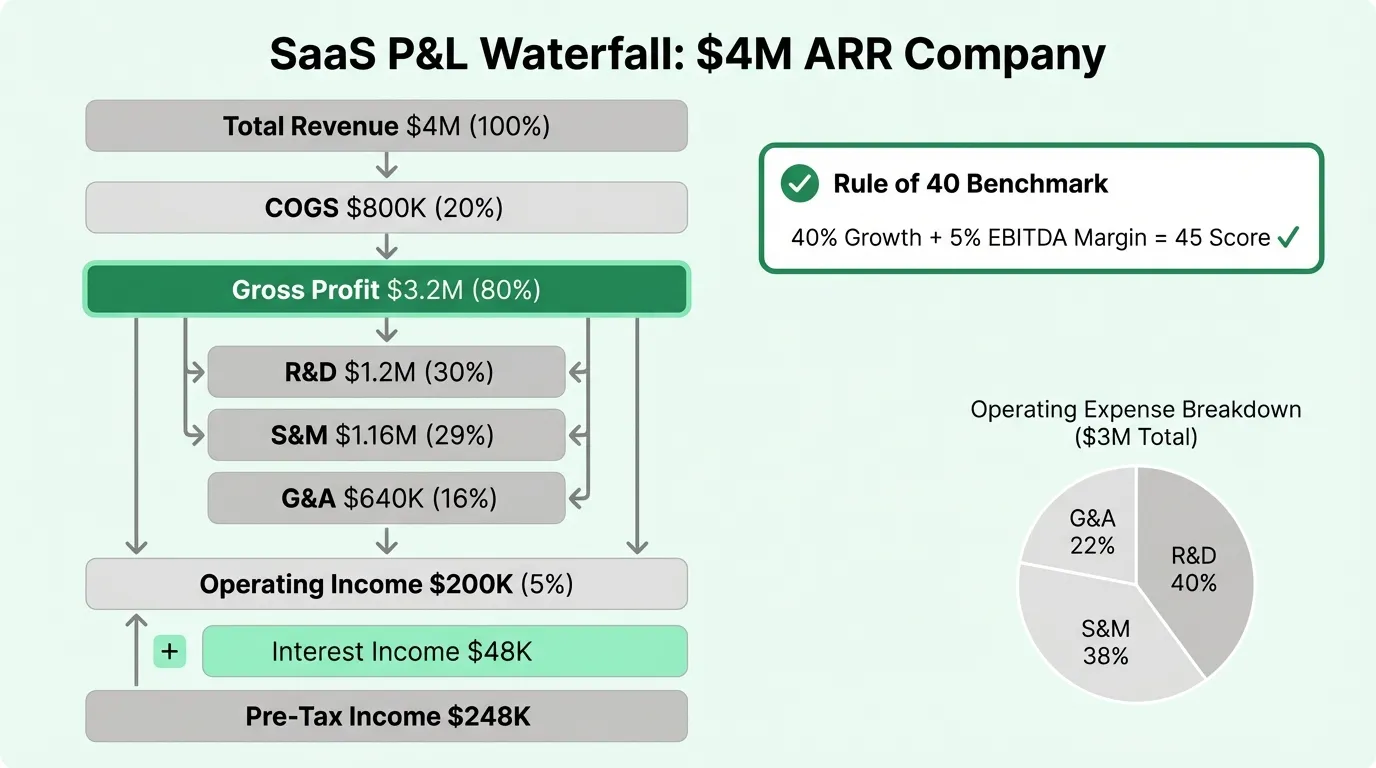
Here's a realistic annual income statement for a B2B SaaS company at $4M ARR, growing 40% year-over-year:
Revenue
| Line | Annual | % of Revenue |
|---|---|---|
| Subscription revenue | $3,840,000 | 96% |
| Professional services | $160,000 | 4% |
| Total revenue | $4,000,000 | 100% |
Note: The $4M GAAP revenue reflects ARR recognized over the year. Deferred revenue on the balance sheet represents contracts billed but not yet earned.
Cost of Revenue
| Line | Annual | % of Revenue |
|---|---|---|
| Hosting and infrastructure (AWS) | $320,000 | 8.0% |
| Customer support (2 FTEs + tooling) | $240,000 | 6.0% |
| Implementation and onboarding | $80,000 | 2.0% |
| Payment processing (Stripe) | $100,000 | 2.5% |
| Third-party software licenses | $60,000 | 1.5% |
| Total COGS | $800,000 | 20.0% |
Gross profit: $3,200,000 (80%)
This is a clean software product with self-serve onboarding and modest support needs — gross margin at 80% is achievable.
Operating Expenses
| Line | Annual | % of Revenue |
|---|---|---|
| Engineering and product (R&D) | $1,200,000 | 30.0% |
| Sales (3 AEs + 1 SDR) | $720,000 | 18.0% |
| Marketing (programs + 1 FTE) | $440,000 | 11.0% |
| Total S&M | $1,160,000 | 29.0% |
| Finance, HR, legal, executive (G&A) | $640,000 | 16.0% |
| Total operating expenses | $3,000,000 | 75.0% |
Operating income (loss): $200,000 (5%)
Below operating income:
| Line | Amount |
|---|---|
| Interest income (cash on hand) | $48,000 |
| Pre-tax income | $248,000 |
| Income tax provision | ($62,000) |
| Net income | $186,000 |
Rule of 40 score: 40% growth + 5% EBITDA margin = 45 — just above the threshold.
This company is lean relative to peers. R&D at 30% is slightly above the public median, reflecting active product investment. S&M at 29% is well below the 40-48% range for growth-stage SaaS — possible because the product has strong organic/inbound demand, reducing paid acquisition spend. G&A at 16% is solid for this ARR level.
What Investors Look At First
When a SaaS investor reads an income statement, they run a quick diagnostic:
Gross margin check. If it's below 70%, that's the first conversation. Is it a structural cost issue, or temporary (heavy onboarding for a complex enterprise product)? Is the company pricing correctly for the value it delivers?
Burn multiple. How much net cash is the company spending per dollar of net new ARR? High gross margin doesn't help if the company is burning $3 to acquire $1 of revenue.
S&M efficiency. S&M as a percentage of revenue is less informative than CAC payback. A company spending 45% of revenue on S&M growing at 80% is more efficient than one spending 35% growing at 15%.
G&A as a future risk. G&A above 20% at $4M+ ARR often signals overhead that will need to be addressed before the company can reach sustainable profitability.
Operating leverage trajectory. Is the operating loss narrowing as a percentage of revenue year-over-year? The trend matters more than the current figure. See how these metrics connect to the balance sheet in our SaaS balance sheet example, especially deferred revenue and cash runway.
For a pre-built version in Excel, the SaaS Income Statement Template includes the line items and structure above with SaaS-specific categories. If you're modeling the business forward, the SaaS Financial Model Template extends the income statement with ARR bridge, cohort analysis, and multi-year projections. For ongoing budget-vs-actual tracking, the SaaS Budget Template provides a monthly comparison view.
Reading Your Own Income Statement Against These Benchmarks
The benchmark table that matters most for an early-stage SaaS company:
| Metric | Early Stage ($1-5M ARR) | Growth Stage ($5-25M ARR) | Scale ($25M+ ARR) |
|---|---|---|---|
| Gross margin | 65-80% | 70-82% | 72-85% |
| R&D % of revenue | 30-50% | 20-35% | 15-25% |
| S&M % of revenue | 40-60% | 35-50% | 25-45% |
| G&A % of revenue | 20-35% | 15-25% | 8-15% |
| Operating margin | -40% to -20% | -20% to 0% | -5% to +20% |
If your gross margin is below 70%, identify which COGS component is the problem. Infrastructure costs above 15% of revenue usually indicate cloud spend that hasn't been optimized. Support costs above 12% often signal a product complexity issue or onboarding gap.
If S&M is above 55% without strong ARR growth to match, that's the efficiency problem to solve — not by cutting spend, but by improving conversion rates and CAC.
The income statement is the summary, not the analysis. The analysis is understanding which line items are within your control, which are structural, and what the trajectory looks like quarter over quarter.
Last updated: March 24, 2026
Frequently Asked Questions
Related Articles
Coffee Shop Income Statement Example: Revenue, Costs, and Margins
A coffee shop income statement example with beverage cost benchmarks, labor targets, prime cost rules, and a worked P&L for an independent café doing $480K/year.
Daycare Income Statement Example: Revenue, Costs, and Margins
A daycare income statement example with tuition revenue, CACFP reimbursements, staff cost benchmarks, and a worked P&L for a 50-child childcare center.
Food Truck Income Statement Example: Line Items and Benchmarks
A food truck income statement example with food cost benchmarks, unique line items like commissary and pitch fees, and a worked P&L for a single-truck operation.
Healthcare Income Statement Example: Revenue, Expenses, and Margins
A healthcare income statement example covering net patient revenue, contractual adjustments, expense benchmarks, and operating margin targets for providers.
Healthcare Pro Forma Example: What to Include and How to Build One
A practical healthcare pro forma example — covering revenue projections, payer mix, expense benchmarks, and a worked model for a new medical practice or service line.
Hotel Pro Forma Example: What to Include and How to Build One
A practical hotel pro forma example — covering RevPAR, GOP, undistributed expenses, FF&E reserves, and a worked model for acquisition or development underwriting.