Nonprofit Business Plan Template
A complete business plan template for nonprofit organizations and charities. Model program revenue and grants, forecast startup costs and equipment needs, and project financial sustainability across three years.
What's Inside This Nonprofit Business Plan Template
This template includes 5 worksheets, each designed for a specific part of your nonprofit financial workflow:
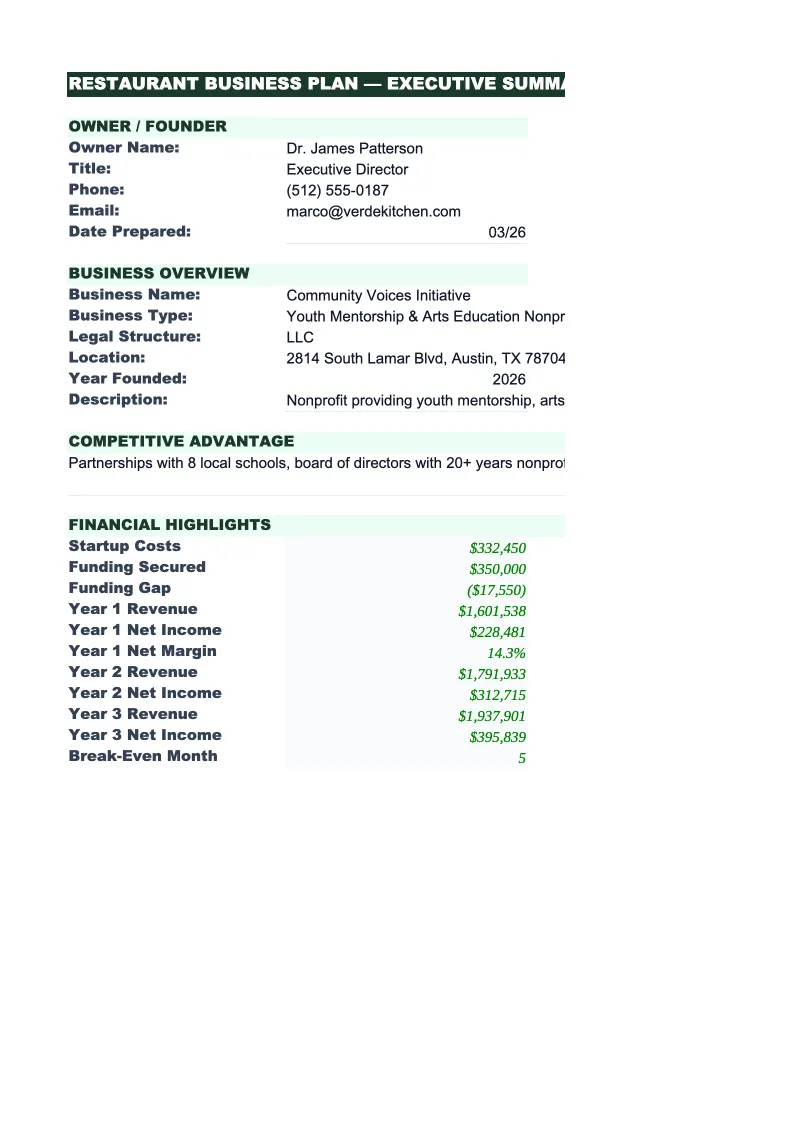
Executive Summary
The one-page snapshot of your nonprofit mission and financial plan, ideal for foundation grant officers and donors.
Startup Costs & Funding
Breaks down the investment required to launch or expand nonprofit operations: office and program facility buildout, furniture and equipment, program delivery materials and supplies, technology and software (donor management, accounting, impact measurement), licenses and permits, initial staffing and training, and working capital for operations during ramp-up.
Revenue Forecast
A 12-month revenue forecast broken by source: foundation grants (major grants with known timing), government contracts (fees for service), individual donations (one-time and recurring), earned revenue from program services (fees charged to participants), corporate sponsorships, and events.
Projected P&L
Annual projections for years 1, 2, and 3 showing total revenue (by funding source), cost of programs (staff, supplies, direct service delivery), administrative overhead (accounting, HR, finance), fundraising costs (grant writing, donor cultivation, events), and program outcomes (beneficiaries served, impact delivered).
Dashboard
A visual summary of your nonprofit's mission impact and financial health.
Nonprofit Business Plan Template Features
- Revenue forecast by source (grants, donations, earned revenue, events) with grant timing assumptions
- Program cost tracking with cost per beneficiary and impact metrics
- Sustainability analysis showing path from startup losses to operational break-even
- Overhead and fundraising cost management with benchmarks for healthy ratios
- Donor and grant pipeline management with conversion and retention tracking
- Dashboard with funding diversification, grant success rate, beneficiary trends, and financial health metrics
How to Use This Nonprofit Business Plan Spreadsheet
Start with the Executive Summary. Write a clear mission statement (what you do, who you serve, why it matters), describe your service model (direct service, capacity building, advocacy), and estimate your impact (how many people you'll serve annually and what outcomes you'll achieve). Grant makers want to fund organizations with clear missions, realistic impact metrics, and strong financial planning. Then move to the Startup Costs & Funding sheet. Estimate your launch costs: office/program space, furniture and equipment, technology, initial staffing, and working capital for operational costs before funding comes in.
Next, go to the Revenue Forecast sheet. Map out your funding sources: which foundations might fund you (research their priorities and funding cycles), what government contracts exist in your space, how many major donors you can cultivate, and what earned revenue you can generate from programs. Grant funding is typically lumpy (when a grant is awarded, it might be a large amount; between awards, you might have zero revenue). Model grant proposals with submission dates and expected decision dates so you understand the timing of cash inflows. Conservative approach: assume 50% of grant proposals you submit will be funded, and assume funding arrives 90 days after award notification.
From mission to funder-ready business plan in under an hour
Define your mission, beneficiaries, and program model. Enter your funding sources and costs. The template builds your 3-year financial projections and sustainability analysis automatically.
Why Nonprofits Need a Solid Business Plan
A nonprofit business plan differs from a for-profit business plan in that it focuses on mission impact and financial sustainability rather than profit maximization. Grant makers want to see: a clear theory of change (how your programs lead to the outcomes you claim), realistic estimates of the people you'll serve and outcomes you'll achieve, a diversified funding strategy (not over-reliant on one funder), and a clear path to financial sustainability (either through earned revenue growth, increasing individual donations, or reducing costs). A nonprofit that's dependent on a single major funder with a declining funding trend will lose donor confidence.
The three metrics that define nonprofit financial health are program spending ratio (percentage of revenue spent on programs vs. admin and fundraising—target 65–85%), overhead ratio (admin and fundraising as percentage of revenue—target below 35%), and funding diversification (no single funder providing more than 40% of revenue). Additionally, nonprofits need to track beneficiary cost (annual cost to serve one beneficiary), outcome achievement (are you delivering the impact you promised), and donor retention rate (what percentage of donors give again the next year). A nonprofit with 75% program spending, 25% overhead, five major funders, strong outcome data, and 60%+ donor retention is financially healthy and positioned for growth.
Nonprofit Industry at a Glance
Financial templates built for nonprofit organizations — from community foundations to service-delivery charities. Pre-loaded with fund accounting categories, grant tracking, and program expense ratios.
Revenue Drivers
- Grants (government & foundation)
- Individual donations
- Program fees
- Membership dues
- Special events
- Corporate sponsorships
Key Cost Categories
- Personnel & benefits
- Program expenses
- Administrative overhead
- Fundraising costs
- Occupancy
- Equipment & technology
Typical Margins
Gross: N/A · Net: 2-5% operating surplus
Seasonality
Grant cycles create Q1 and Q4 revenue spikes; year-end giving peaks in December. Fiscal years often run July–June rather than calendar year.
Key Performance Indicators
Nonprofit Business Plan Template FAQ
More Nonprofit Templates
Nonprofit Balance Sheet Template for Excel
$29
Nonprofit Budget Template for Excel
$29
Nonprofit Cash Flow Template for Excel
$29
Nonprofit Expense Tracker Template for Excel
$29
Nonprofit Financial Model Template for Excel
$29
Nonprofit Income Statement Template for Excel
$29
Nonprofit Invoice Template for Excel
$29
Nonprofit KPI Dashboard Template for Excel
$29
Nonprofit P&L Template for Excel
$29
Nonprofit Pro Forma Template for Excel
$29
Nonprofit Project Budget Template for Excel
$29
Nonprofit Sales Forecast Template for Excel
$29
Nonprofit Valuation Template for Excel
$29
More Business Plan Templates
Nonprofit Business Plan Template
$39