Nonprofit Financial Model Template
Model your nonprofit's revenue by funding source, track program expense ratios and operating reserves, and forecast 24 months of P&L and cash flow — built for 501(c)(3) organizations managing grant cycles, donor campaigns, and program budgets.
What's Inside This Nonprofit Financial Model Template
This template includes 7 worksheets, each designed for a specific part of your nonprofit financial workflow:
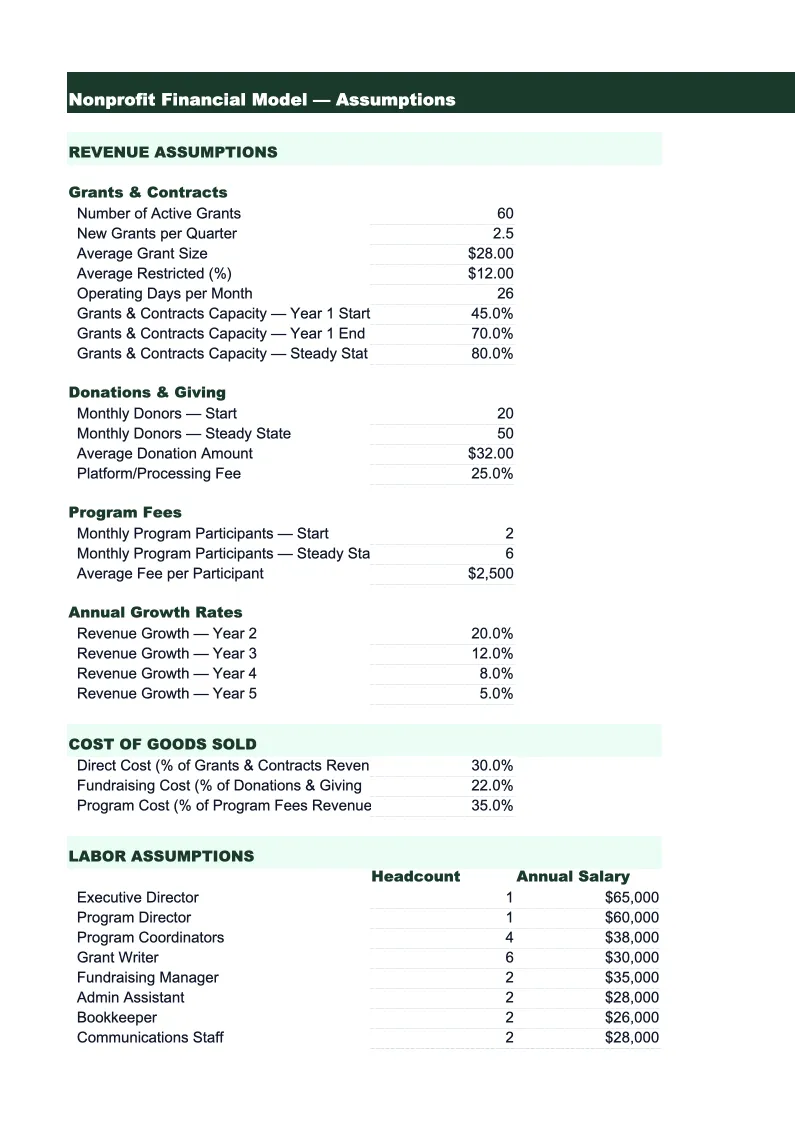
Assumptions
The central input sheet that drives every projection in the model.
Revenue Model
A 24-month revenue projection broken down by funding stream with grant timing built in.
Grant Tracker
A dedicated sheet for managing the active grant portfolio alongside financial projections.
Program Expense Allocation
A functional expense allocation sheet that distributes costs across program services, management and general, and fundraising — the three functional categories required for IRS Form 990 reporting and used to calculate the program expense ratio and fundraising efficiency ratio.
P&L
A 24-month statement of activities structured for nonprofit accounting — revenue over expenses rather than profit and loss, with net assets changing by restricted and unrestricted status.
Cash Flow
A monthly cash flow statement that models the timing gap between nonprofit grant awards and actual cash receipt.
Dashboard
A one-page summary built for board meetings, funder presentations, and annual planning sessions.
Nonprofit Financial Model Template Features
- Revenue model by funding stream: government grants, foundation grants, corporate sponsorships, individual giving, and program fees projected separately with realistic timing
- Grant tracker with spending velocity, expiration alerts, and renewal pipeline gap calculations
- Functional expense allocation across program services, management/general, and fundraising for Form 990 reporting
- Program expense ratio and fundraising efficiency calculated monthly against watchdog thresholds
- Restricted vs. unrestricted revenue and net assets tracked separately throughout the 24-month model
- Operating reserve months calculated each period and flagged when below the three-month recommended minimum
How to Use This Nonprofit Financial Model Spreadsheet
Start in the Assumptions sheet. Enter your funding source mix and grant portfolio — for each active grant, set the award amount, period, and payment schedule. If you're an existing organization, pull your most recent Form 990 and audited financials to find your actual revenue breakdown by source and your program expense ratio for the past two years. These numbers are your baseline; they tell you what the organization actually looks like financially, not what the budget says it should look like. Next, enter your personnel costs and operating expenses. Pay attention to the benefit load percentage — most nonprofits run 18–25% on top of base salary when you include health insurance, retirement contributions, and payroll taxes. With those inputs in place, every sheet in the model populates automatically and you have a 24-month projection to work from.
Once the model is loaded, start with the Grant Tracker sheet before reviewing the P&L. The tracker shows whether any active grants are underspent relative to their expiration date and flags the revenue gap if grants in the renewal pipeline don't come through. This is where nonprofits most commonly find surprises — a grant that ends in Q2 and hasn't been renewed creates a revenue hole that won't show up clearly on a budget spreadsheet but is immediately visible here. Then move to the P&L and check your program expense ratio and operating reserve months. If the program expense ratio is below 70%, review the functional expense allocation: the most common cause is overhead costs growing faster than program spending, which funders notice on Form 990 before you do. If operating reserves are below two months, use the Cash Flow sheet to find the specific months where unrestricted cash hits its lowest point and plan accordingly.
15 minutes from download to your first nonprofit financial projection
Download the template, plug in your grant portfolio and funding mix, and see your organization's full financial picture — revenue by source, program expense ratio, operating reserves, and 24-month cash flow included.
Why Every Nonprofit Needs a Financial Model
Nonprofit financial planning is complicated by a structural mismatch that most for-profit financial tools ignore: the organization can show a surplus on paper while being unable to make payroll, because its cash is tied up in restricted grant accounts that can only be spent on specific programs. A restaurant or retail business has one pool of cash; a nonprofit often has ten — each with its own rules, timelines, and reporting requirements. A financial model that tracks restricted and unrestricted revenue separately, and maps cash inflows to grant payment schedules rather than award dates, is not a nice-to-have for a growing nonprofit. It's the difference between catching a cash gap in October and discovering it in the second week of November when payroll is due.
The metrics that determine nonprofit financial health are different from for-profit metrics, and most generic financial models don't calculate them. Program expense ratio — the percentage of total expenses that go directly to program work rather than administration or fundraising — is the primary metric donors, watchdog organizations like Charity Navigator, and institutional funders use to evaluate organizational efficiency. A ratio above 75% is generally considered good; above 85% is strong. Fundraising efficiency, measured as cost per dollar raised, should typically run between $0.15 and $0.25 per dollar for most fundraising programs. And operating reserves — unrestricted net assets expressed as months of operating expenses — should be at least three months for a stable organization, six months for one with significant grant concentration risk. This model calculates all three metrics monthly and tracks them against targets so the board and executive director can see trends before they show up on a 990 two years later.
Nonprofit Industry at a Glance
Financial templates built for nonprofit organizations — from community foundations to service-delivery charities. Pre-loaded with fund accounting categories, grant tracking, and program expense ratios.
Revenue Drivers
- Grants (government & foundation)
- Individual donations
- Program fees
- Membership dues
- Special events
- Corporate sponsorships
Key Cost Categories
- Personnel & benefits
- Program expenses
- Administrative overhead
- Fundraising costs
- Occupancy
- Equipment & technology
Typical Margins
Gross: N/A · Net: 2-5% operating surplus
Seasonality
Grant cycles create Q1 and Q4 revenue spikes; year-end giving peaks in December. Fiscal years often run July–June rather than calendar year.
Key Performance Indicators
Nonprofit Financial Model Template FAQ
More Nonprofit Templates
Nonprofit Balance Sheet Template for Excel
$29
Nonprofit Budget Template for Excel
$29
Nonprofit Business Plan Template for Excel
$39
Nonprofit Cash Flow Template for Excel
$29
Nonprofit Expense Tracker Template for Excel
$29
Nonprofit Income Statement Template for Excel
$29
Nonprofit Invoice Template for Excel
$29
Nonprofit KPI Dashboard Template for Excel
$29
Nonprofit P&L Template for Excel
$29
Nonprofit Pro Forma Template for Excel
$29
Nonprofit Project Budget Template for Excel
$29
Nonprofit Sales Forecast Template for Excel
$29
Nonprofit Valuation Template for Excel
$29
More Financial Model Templates
Nonprofit Financial Model Template
$29