Nonprofit Sales Forecast Template
Project your nonprofit's revenue across grants, donations, events, and program fees — with a pre-built grant pipeline tracker and monthly revenue rollup built for development teams.
What's Inside This Nonprofit Sales Forecast Template
This template includes 6 worksheets, each designed for a specific part of your nonprofit financial workflow:
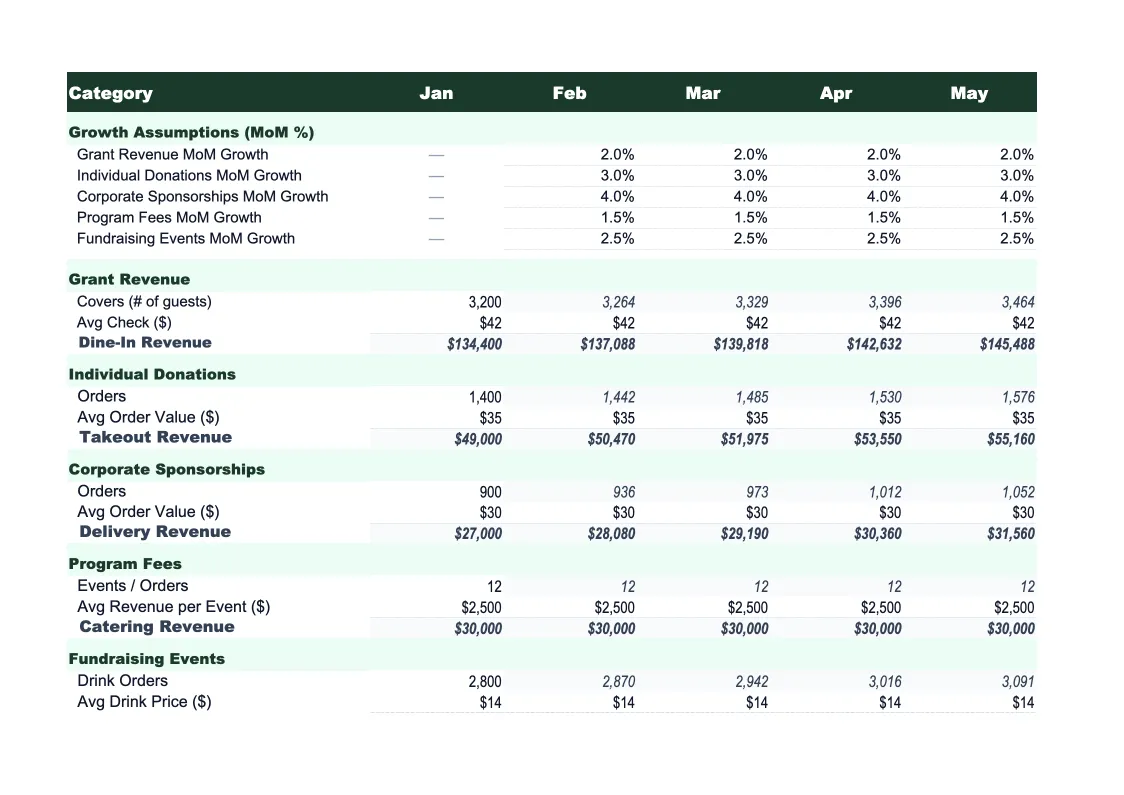
Revenue Forecast
The core planning sheet where you project each revenue stream by month across a 12-month period.
Grant Pipeline
A deal-stage tracker for every grant you're pursuing, submitted, or waiting on.
Donation Forecast
A segment-by-segment projection for individual giving, broken out by major donors, annual fund donors, online giving, peer-to-peer campaigns, and planned giving.
Actual vs Forecast
A variance tracker that compares your projected revenue to what actually came in, updated monthly as gifts are received and grants are awarded.
Scenario Planning
Three parallel revenue models — base case, optimistic, and conservative — built from the same driver assumptions as the Revenue Forecast sheet.
Development Calendar
A month-by-month calendar mapping every major fundraising activity to the fiscal year — grant submission deadlines, renewal windows, major gift solicitations, annual appeal mailings, gala and event dates, and planned stewardship touches.
Nonprofit Revenue Forecast Template Features
- Grant pipeline tracker with probability-weighted expected value
- Revenue projections across 6 streams: grants, donations, events, fees, memberships, and sponsorships
- Monthly donation forecast with segment-level driver assumptions (donor count, average gift, retention rate)
- Actual vs forecast variance tracker with color-coded alerts
- Three-scenario model (base, optimistic, conservative) with dropdown toggle
- Development calendar mapping fundraising activities to projected revenue
How to Use This Nonprofit Revenue Forecast Spreadsheet
Start with the Grant Pipeline sheet before anything else. List every grant you're pursuing, submitted, or waiting on — include the funder, request amount, deadline, and your honest probability estimate. This gives you a realistic picture of confirmed versus probable revenue before you set targets. Once the pipeline is populated, move to the Revenue Forecast sheet and enter projections for your other streams: individual donations, program fees, events, and memberships. The whole setup takes about 30–45 minutes if you have your development calendar and last year's actuals in front of you.
Use the Donation Forecast sheet to stress-test your individual giving projections. Enter your actual donor count by segment, average gift size, and retention rate — not the numbers you hope for, but what your data shows. If your online giving retention rate is 38%, that's the number to use. The model will show you what's realistic based on your current donor base and give you a target to beat through acquisition and upgrade strategies. Adjust the driver assumptions whenever you launch a new campaign or see a meaningful change in giving patterns.
15 minutes from download to your first revenue projection
Download the template, plug in your grant pipeline and donor data, and get a clear picture of your nonprofit's revenue outlook for the year.
Why Every Nonprofit Needs a Revenue Forecast Template
Nonprofits face a revenue forecasting challenge that for-profit businesses don't: most of your revenue is uncertain until it arrives. Grant decisions come months after submission, major donors make commitments verbally before they write checks, and event revenue swings with attendance and weather. Without a structured forecast, development teams tend to run on optimism — counting on grants before they're awarded and planning programs based on last year's numbers rather than what's actually in the pipeline. That gap between assumed and real revenue is where most nonprofit budget crises originate.
A proper nonprofit revenue forecast treats each stream differently because they behave differently. Grants have a predictable timeline (proposal, review, award, disbursement) and a probability you can assign based on your history with the funder and the program fit. Individual donations are driven by donor retention rates, upgrade rates, and acquisition — if you know your average retention is 45% and your average gift is $175, you can project the giving from your current file with reasonable accuracy and set acquisition targets for the gap. Program fees and memberships are the most predictable: they're tied to enrollment or membership count and rarely swing wildly quarter to quarter. Modeling each stream separately, with its own assumptions, produces a more accurate picture than a single top-line number.
Nonprofit Industry at a Glance
Financial templates built for nonprofit organizations — from community foundations to service-delivery charities. Pre-loaded with fund accounting categories, grant tracking, and program expense ratios.
Revenue Drivers
- Grants (government & foundation)
- Individual donations
- Program fees
- Membership dues
- Special events
- Corporate sponsorships
Key Cost Categories
- Personnel & benefits
- Program expenses
- Administrative overhead
- Fundraising costs
- Occupancy
- Equipment & technology
Typical Margins
Gross: N/A · Net: 2-5% operating surplus
Seasonality
Grant cycles create Q1 and Q4 revenue spikes; year-end giving peaks in December. Fiscal years often run July–June rather than calendar year.
Key Performance Indicators
Nonprofit Sales Forecast Template FAQ
More Nonprofit Templates
Nonprofit Balance Sheet Template for Excel
$29
Nonprofit Budget Template for Excel
$29
Nonprofit Business Plan Template for Excel
$39
Nonprofit Cash Flow Template for Excel
$29
Nonprofit Expense Tracker Template for Excel
$29
Nonprofit Financial Model Template for Excel
$29
Nonprofit Income Statement Template for Excel
$29
Nonprofit Invoice Template for Excel
$29
Nonprofit KPI Dashboard Template for Excel
$29
Nonprofit P&L Template for Excel
$29
Nonprofit Pro Forma Template for Excel
$29
Nonprofit Project Budget Template for Excel
$29
Nonprofit Valuation Template for Excel
$29
More Sales Forecast Templates
Nonprofit Sales Forecast Template
$29