Nonprofit P&L Template
Track revenue, program expenses, and operating surplus with a P&L template built for nonprofits — pre-loaded with fund categories, grant tracking, and program expense ratio calculations.
What's Inside This Nonprofit P&L Template
This template includes 5 worksheets, each designed for a specific part of your nonprofit financial workflow:
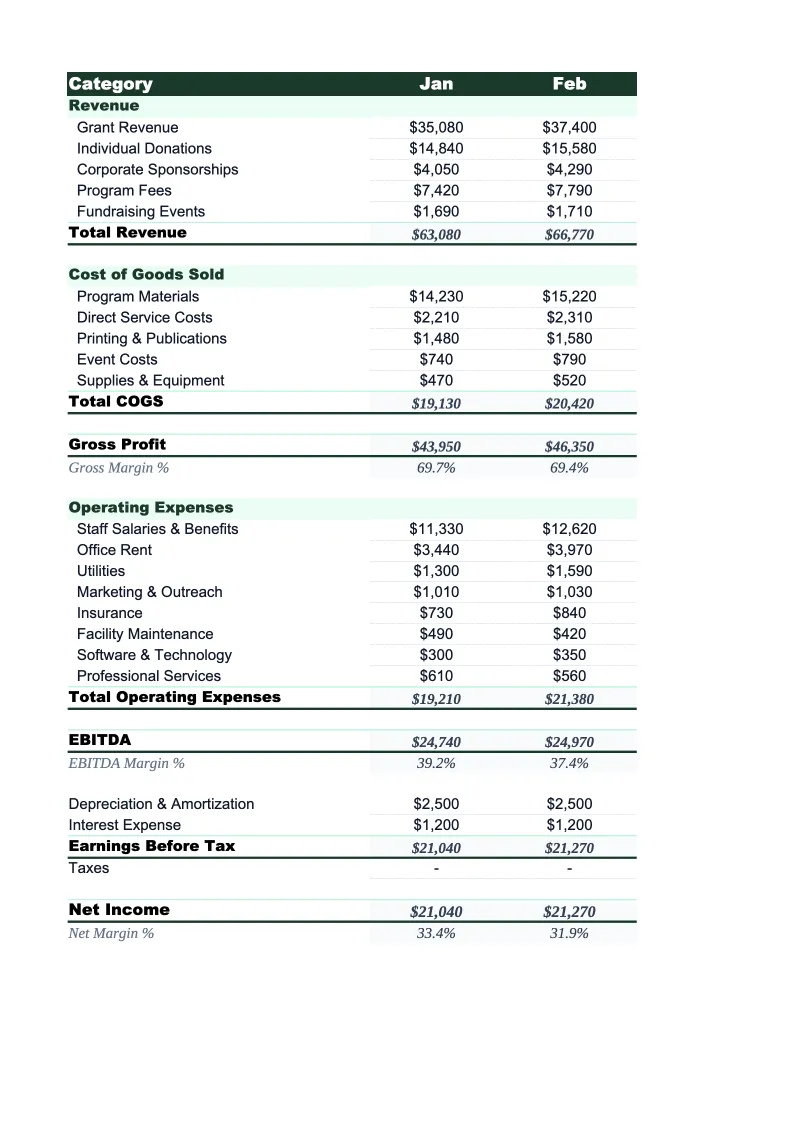
Monthly P&L
The primary worksheet showing your organization's revenue and expenses for each month.
Program Expense Breakdown
A worksheet that allocates expenses across your specific programs or service lines.
Annual Summary
A full-year view that rolls up the 12 monthly P&L sheets automatically.
Grant Tracker
A dedicated worksheet for tracking individual grants across their full lifecycle.
Dashboard
A one-page visual summary with charts and KPI boxes showing your organization's financial health at a glance.
Nonprofit P&L Template Features
- Revenue tracked by source: grants, donations, fees, events, and sponsorships
- Functional expense split: program services, management & general, fundraising
- Program expense ratio calculated automatically (target: 75%+)
- Grant tracker with restricted vs. unrestricted fund tracking
- Monthly P&L with 12-month annual rollup
- Dashboard with fundraising efficiency and operating reserve metrics
How to Use This Nonprofit P&L Spreadsheet
Download the .xlsx file and open it in Excel or Google Sheets. Start with the Monthly P&L sheet and review the pre-loaded revenue and expense categories. Rename or adjust the revenue lines to match your specific funding sources — most organizations will keep the structure but relabel a few rows. In the Program Expense Breakdown sheet, replace the placeholder program names with your actual programs or service lines. This setup takes about 20 minutes and only needs to happen once.
Each month, enter your actual revenue by source and actual expenses by functional category in the Monthly P&L. If you track grant revenue on a cash basis (when received) or an accrual basis (when earned), stay consistent throughout the file. Use the Grant Tracker to log each active grant, enter award amounts, and note any spending restrictions. As you enter monthly data, the Annual Summary and Dashboard update automatically — you don't need to touch those sheets to keep them current.
15 minutes from download to your first nonprofit P&L
Download the template, enter your funding sources and programs, and see your organization's full financial picture — with program expense ratio and operating reserve calculated automatically.
Why Every Nonprofit Needs a P&L Template
Nonprofit financial management operates under different rules than for-profit accounting. Revenue isn't just income — it's grants with restrictions, donations with donor intent, and program fees that may need to be tracked separately from unrestricted funds. Expenses aren't just costs — they're allocated across program, administrative, and fundraising categories that stakeholders use to judge your organization's efficiency. Without a P&L structured around these categories, you're producing financial reports that don't tell the story funders and board members need to hear.
The program expense ratio is the number nonprofits get evaluated on most heavily. Charity Navigator, GuideStar, and most institutional funders expect to see 65–80% or more of total expenses going directly to programs rather than overhead. But calculating that ratio requires knowing exactly how to categorize each expense — and for shared costs like rent, staff time, and technology, that means making a defensible allocation between program, administrative, and fundraising. This template does that allocation math for you and shows the resulting ratio on the dashboard, so you can monitor it monthly instead of discovering a problem when the 990 is already filed.
Nonprofit Industry at a Glance
Financial templates built for nonprofit organizations — from community foundations to service-delivery charities. Pre-loaded with fund accounting categories, grant tracking, and program expense ratios.
Revenue Drivers
- Grants (government & foundation)
- Individual donations
- Program fees
- Membership dues
- Special events
- Corporate sponsorships
Key Cost Categories
- Personnel & benefits
- Program expenses
- Administrative overhead
- Fundraising costs
- Occupancy
- Equipment & technology
Typical Margins
Gross: N/A · Net: 2-5% operating surplus
Seasonality
Grant cycles create Q1 and Q4 revenue spikes; year-end giving peaks in December. Fiscal years often run July–June rather than calendar year.
Key Performance Indicators
Nonprofit P&L Template FAQ
More Nonprofit Templates
Nonprofit Balance Sheet Template for Excel
$29
Nonprofit Budget Template for Excel
$29
Nonprofit Business Plan Template for Excel
$39
Nonprofit Cash Flow Template for Excel
$29
Nonprofit Expense Tracker Template for Excel
$29
Nonprofit Financial Model Template for Excel
$29
Nonprofit Income Statement Template for Excel
$29
Nonprofit Invoice Template for Excel
$29
Nonprofit KPI Dashboard Template for Excel
$29
Nonprofit Pro Forma Template for Excel
$29
Nonprofit Project Budget Template for Excel
$29
Nonprofit Sales Forecast Template for Excel
$29
Nonprofit Valuation Template for Excel
$29
Nonprofit P&L Template
$29