Nonprofit KPI Dashboard Template
Track your nonprofit's key performance indicators — program efficiency, fundraising ROI, donor retention, and operating reserves — in one dashboard built for 501(c)(3) organizations.
What's Inside This Nonprofit KPI Dashboard Template
This template includes 5 worksheets, each designed for a specific part of your nonprofit financial workflow:
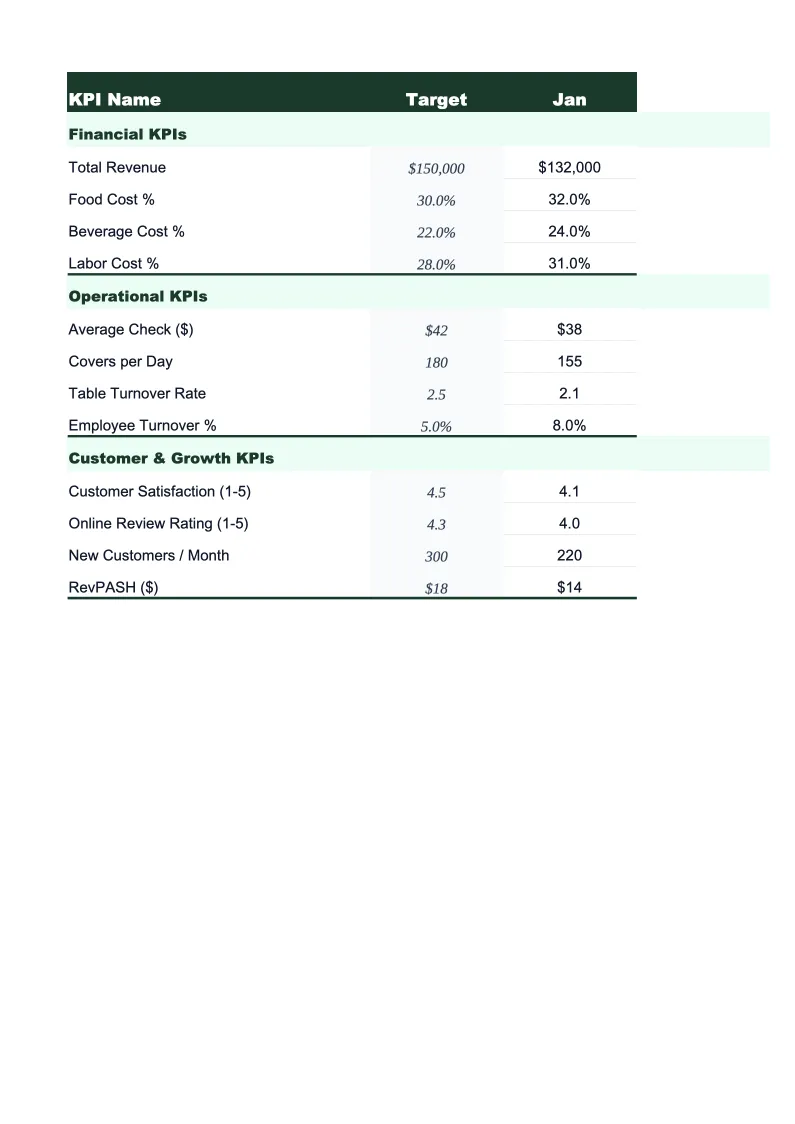
KPI Overview
The main dashboard that displays your organization's most critical performance indicators at a glance.
Program Performance
Tracks the metrics that funders and watchdog organizations look at most closely: program expense ratio (the percentage of total expenses going directly to programs), cost per beneficiary, and program-level budget vs.
Fundraising & Development
Monitors the efficiency and sustainability of your fundraising operation.
Financial Health
Tracks the financial stability metrics that boards and auditors care about: operating reserve months (how long you could operate without new revenue), unrestricted net assets, budget-to-actual variance for the fiscal year, and revenue diversification by source — grants, individual donations, program fees, and events.
Monthly Trends
A 12-month rolling view of your top five KPIs — program expense ratio, donor retention, fundraising efficiency, total revenue, and operating reserve months — displayed as line charts so you can see how performance has moved over time.
Nonprofit KPI Dashboard Template Features
- Program expense ratio with automatic calculation and benchmark comparison
- Fundraising efficiency ratio (cost per dollar raised) by campaign
- Donor retention rate tracking — first-time vs. repeat donor breakdown
- Operating reserve months calculation per auditing standards
- Cost per beneficiary by program with 8-program capacity
- Revenue diversification by source: grants, donations, fees, events
How to Use This Nonprofit KPI Spreadsheet
Getting started takes about 20 minutes. Download the .xlsx file and open it in Excel or Google Sheets. Start with the Financial Health sheet: enter your current unrestricted net assets, monthly operating expenses, and revenue breakdown by source. Then move to Program Performance and enter your program expense totals and beneficiary counts for the current period. The KPI Overview dashboard populates automatically from those inputs, giving you a live picture of your key metrics before you've finished setup.
For ongoing use, update the monthly figures at the end of each month — or, for organizations on a grant-cycle calendar, after each reporting period closes. The Fundraising & Development sheet is most useful when updated after each major campaign: enter the total raised and total fundraising costs for the appeal or event, and it calculates your cost-per-dollar and campaign ROI immediately. If your organization tracks program-level actuals in a separate accounting system, you can copy monthly totals from your accounting export directly into the Program Performance sheet.
20 minutes from download to your first board dashboard
Download the template, enter your current financials, and walk into your next board meeting with a clear picture of program efficiency, fundraising ROI, and financial reserves.
Why Every Nonprofit Needs a KPI Dashboard
Nonprofits operate under a different kind of financial scrutiny than for-profit businesses. Watchdog organizations like Charity Navigator, GuideStar, and the Better Business Bureau's Wise Giving Alliance rate organizations on a handful of specific ratios — program expense ratio, fundraising efficiency, and financial reserves — and major institutional funders increasingly require that grant applicants report these metrics in standard formats. Yet most nonprofits track their KPIs in ad-hoc spreadsheets or pull them manually from audited financials once a year, which means the data is always months out of date and presented differently to every stakeholder who asks.
The metrics that matter most in the nonprofit sector are well-established. Program expense ratio — the share of total expenses going directly to mission-related programs — should generally sit at 65% or above, with many watchdog organizations using 75% as their threshold for top ratings. Fundraising efficiency, measured as the cost to raise one dollar, should be $0.25 or less for most established organizations, though newer nonprofits and capital campaigns often run higher. Operating reserve months — how long you can operate at current expense levels without new revenue — should be three to six months minimum, and boards of larger organizations often target twelve. Donor retention rate, which the sector tracks at around 43% nationally, is one of the highest-leverage metrics for sustainable growth: retaining 10% more donors has a larger long-term impact on revenue than acquiring the same number of new donors.
Nonprofit Industry at a Glance
Financial templates built for nonprofit organizations — from community foundations to service-delivery charities. Pre-loaded with fund accounting categories, grant tracking, and program expense ratios.
Revenue Drivers
- Grants (government & foundation)
- Individual donations
- Program fees
- Membership dues
- Special events
- Corporate sponsorships
Key Cost Categories
- Personnel & benefits
- Program expenses
- Administrative overhead
- Fundraising costs
- Occupancy
- Equipment & technology
Typical Margins
Gross: N/A · Net: 2-5% operating surplus
Seasonality
Grant cycles create Q1 and Q4 revenue spikes; year-end giving peaks in December. Fiscal years often run July–June rather than calendar year.
Key Performance Indicators
Nonprofit KPI Dashboard Template FAQ
More Nonprofit Templates
Nonprofit Balance Sheet Template for Excel
$29
Nonprofit Budget Template for Excel
$29
Nonprofit Business Plan Template for Excel
$39
Nonprofit Cash Flow Template for Excel
$29
Nonprofit Expense Tracker Template for Excel
$29
Nonprofit Financial Model Template for Excel
$29
Nonprofit Income Statement Template for Excel
$29
Nonprofit Invoice Template for Excel
$29
Nonprofit P&L Template for Excel
$29
Nonprofit Pro Forma Template for Excel
$29
Nonprofit Project Budget Template for Excel
$29
Nonprofit Sales Forecast Template for Excel
$29
Nonprofit Valuation Template for Excel
$29
More KPI Dashboard Templates
Nonprofit KPI Dashboard Template
$29