Nonprofit Cash Flow Template
Manage your nonprofit's cash position across grant cycles, fundraising seasons, and program expenses with a cash flow template built for fund-based organizations.
What's Inside This Nonprofit Cash Flow Template
This template includes 5 worksheets, each designed for a specific part of your nonprofit financial workflow:
13-Week Cash Flow
A rolling 13-week projection of cash inflows and outflows broken down by week — the most practical planning horizon for nonprofits navigating the gap between grant cycles and seasonal giving.
Monthly Cash Flow
A 12-month cash flow view that maps your full fiscal year, whether you run January–December or July–June.
Grant & Revenue Tracker
A dedicated sheet for tracking expected grant disbursements, pledge payments, and major gift commitments over the next 12 months.
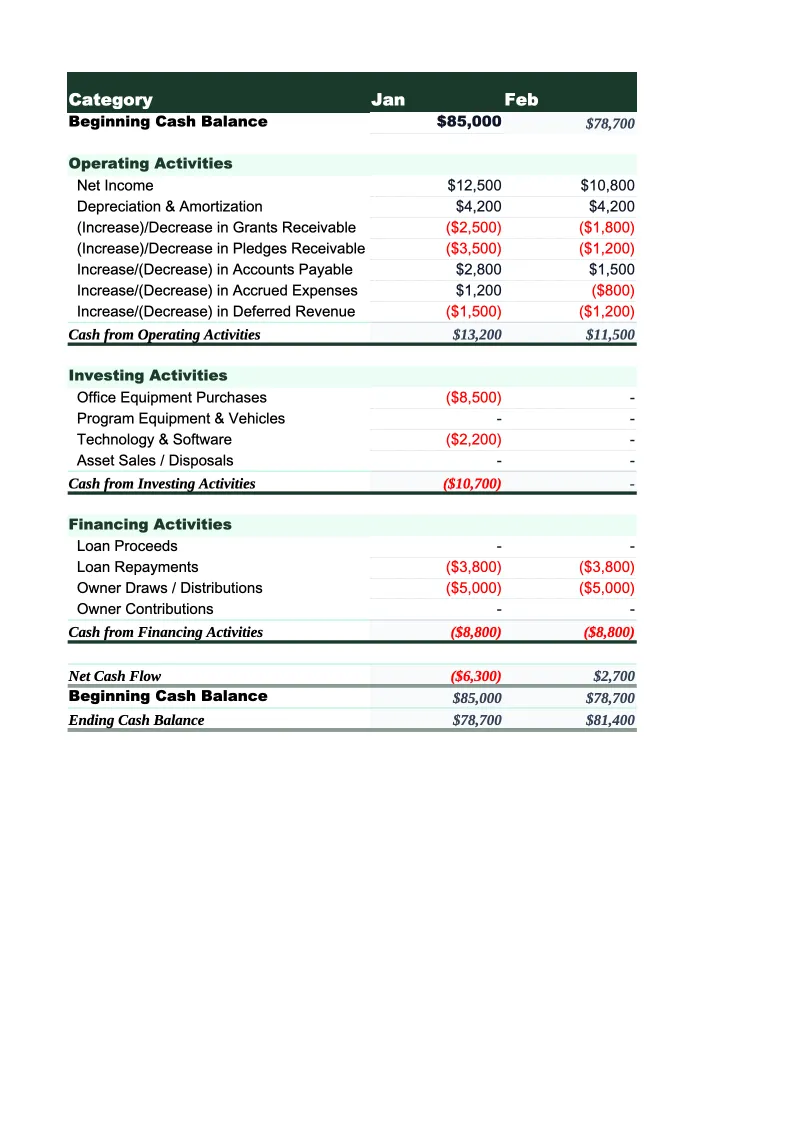
Annual Cash Flow Statement
A formal cash flow statement using the indirect method, structured for board presentations, auditor review, and foundation reporting.
Dashboard
A single-page visual summary showing current cash balance, 13-week cash runway in weeks, total grants and pledges expected in the next 90 days, and a bar chart of monthly cash inflows vs.
Nonprofit Cash Flow Template Features
- 13-week rolling cash flow with nonprofit-specific inflow categories (grants, donations, event proceeds)
- Grant and pledge tracker with expected disbursement dates and overdue flags
- 12-month fiscal year view covering both calendar-year and July–June organizations
- Formal annual cash flow statement structured for board and auditor review
- Operating reserve months and fundraising efficiency ratio calculated automatically
- Visual dashboard with cash runway, monthly cash flow chart, and key liquidity metrics
How to Use This Nonprofit Cash Flow Spreadsheet
Start with the 13-Week Cash Flow sheet. Download the file and open it in Excel or Google Sheets — no macros or plugins required. Enter your current operating cash balance in the starting balance cell, then fill in expected inflows for the next 13 weeks: scheduled grant disbursements, any pledge payments due, upcoming event proceeds, and routine program fee income. Most finance staff can complete this in 20–30 minutes using their grant award letters, pledge schedules, and bank statements from the prior two months.
Next, set up the Grant & Revenue Tracker. Enter every active grant, pledge, and major gift commitment — the funder name, total amount, payment schedule, and expected receipt dates. This is often the most revealing step: seeing all expected cash inflows on one sheet shows you exactly which months are healthy and which months depend on a single grant arriving on time. Update the tracker each time a payment arrives or a disbursement date shifts, and the 13-week projection will reflect the change automatically.
15 minutes from download to your first cash flow projection
Download the template, enter your grant schedule and upcoming expenses, and see your nonprofit's cash position across the full fiscal year.
Why Nonprofits Need a Cash Flow Template
Nonprofits face a cash management challenge that most for-profit businesses don't: the gap between when expenses are due and when revenue arrives is built into the funding model. Payroll runs biweekly. Rent is due on the first. But grant disbursements arrive on foundation payment cycles — quarterly, semi-annually, or at grant milestones — and year-end donations concentrate in December. A well-run nonprofit with $800K in annual revenue can be eight weeks from an empty bank account in March simply because three grants are scheduled to disburse in April. Without a cash flow projection, that gap is invisible until it becomes a crisis.
The metrics that matter most to nonprofit financial health are different from for-profit businesses. Operating reserve months — how many months of operating expenses you could fund from unrestricted cash alone — is the primary liquidity indicator. Most financial advisors recommend three to six months of reserves; many smaller nonprofits operate with less than two. Program expense ratio measures what percentage of total spending goes directly to programs vs. overhead and fundraising — funders and rating agencies like Charity Navigator look for 75–85%. Fundraising efficiency tracks how much was raised per dollar spent on fundraising. This template calculates all three automatically and displays them on the Dashboard.
Nonprofit Industry at a Glance
Financial templates built for nonprofit organizations — from community foundations to service-delivery charities. Pre-loaded with fund accounting categories, grant tracking, and program expense ratios.
Revenue Drivers
- Grants (government & foundation)
- Individual donations
- Program fees
- Membership dues
- Special events
- Corporate sponsorships
Key Cost Categories
- Personnel & benefits
- Program expenses
- Administrative overhead
- Fundraising costs
- Occupancy
- Equipment & technology
Typical Margins
Gross: N/A · Net: 2-5% operating surplus
Seasonality
Grant cycles create Q1 and Q4 revenue spikes; year-end giving peaks in December. Fiscal years often run July–June rather than calendar year.
Key Performance Indicators
Nonprofit Cash Flow Template FAQ
More Nonprofit Templates
Nonprofit Balance Sheet Template for Excel
$29
Nonprofit Budget Template for Excel
$29
Nonprofit Business Plan Template for Excel
$39
Nonprofit Expense Tracker Template for Excel
$29
Nonprofit Financial Model Template for Excel
$29
Nonprofit Income Statement Template for Excel
$29
Nonprofit Invoice Template for Excel
$29
Nonprofit KPI Dashboard Template for Excel
$29
Nonprofit P&L Template for Excel
$29
Nonprofit Pro Forma Template for Excel
$29
Nonprofit Project Budget Template for Excel
$29
Nonprofit Sales Forecast Template for Excel
$29
Nonprofit Valuation Template for Excel
$29
Nonprofit Cash Flow Template
$29