Cleaning Service Financial Model Template
A complete financial model for residential and commercial cleaning businesses — project revenue by service type, plan your labor costs, track supply expenses, and see your full P&L and cash flow in one connected workbook.
What's Inside This Cleaning Service Financial Model Template
This template includes 7 worksheets, each designed for a specific part of your cleaning service financial workflow:
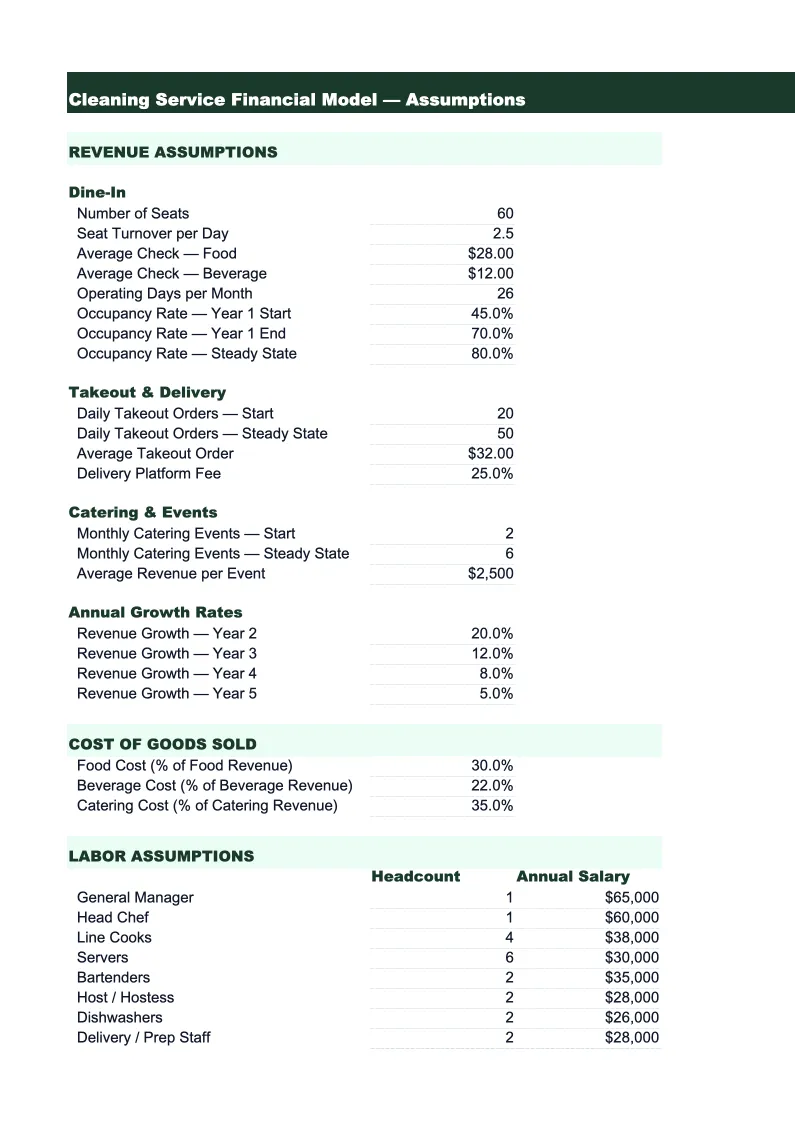
Assumptions
The central inputs sheet where you define the business drivers that flow through every other sheet in the model.
Revenue Projections
A 12-month revenue forecast broken out by service type: recurring residential cleaning contracts, recurring commercial contracts, one-time deep cleans, move-in and move-out cleans, and specialty services like post-construction or event cleanup.
Labor Planning
Tracks your cleaner headcount, hourly wages, and billable hours utilization across the 12-month projection period.
Expense Budget
A detailed monthly expense forecast covering all non-labor operating costs.
P&L
A monthly income statement covering the full 12-month projection period.
Cash Flow
A monthly cash flow statement that models the timing of cash in and cash out.
KPI Dashboard
A visual summary of the metrics that matter most for a cleaning operation.
Cleaning Service Financial Model Template Features
- Revenue model split across 5 service types: recurring residential, commercial contracts, one-time deep cleans, move-in/move-out, and specialty services
- Labor planning sheet models billable hours utilization and the cost of adding a new cleaner at any point in the year
- Supply costs calculated per job from volume — so expenses scale correctly as revenue grows
- Full 3-statement model: monthly P&L, cash flow statement, and projected balance sheet
- Monthly cash balance forecast that flags any shortfalls before they happen
- KPI dashboard with revenue per cleaner per day, labor cost %, and gross margin trend
How to Use This Cleaning Service Financial Model Spreadsheet
Open the Assumptions sheet first and enter the numbers that describe your current business: cleaner count, billing rates by service type, how many recurring clients you have, average visit frequency, and your supply cost per job. If you run both residential and commercial accounts, set them up as separate service types — they have different billing rates, margin profiles, and payment timing. Getting these inputs right is worth spending 20–30 minutes on, because every other sheet in the model derives from them. Use your last few months of actual revenue as a sanity check on the numbers before moving on.
Once your assumptions are in, review the Revenue Projections sheet to confirm the monthly totals look realistic. Compare the recurring residential and commercial rows against your actual contract list — if you have 40 residential accounts visiting twice a month, the model should reflect that. Then open the Labor Planning sheet and verify that your projected job volume can actually be handled by your current cleaner count at a utilization rate that's achievable in practice. Most cleaning businesses run 75–85% billable utilization; if the model is showing 95%, either your revenue estimates are too high or you need to plan a hire sooner than you thought.
15 minutes from download to your first cleaning business projection
Download the template, enter your cleaner count and billing rates, and see your full-year revenue, labor costs, and cash flow in one connected workbook.
Why Every Cleaning Business Needs a Financial Model
Cleaning businesses sit in an unusual financial position for service companies: the work is labor-intensive, the margins are thin, and the real profit comes from scale and retention rather than from any single job. A residential cleaning company doing $200,000 in annual revenue with a 45% gross margin and 15% net margin generates about $30,000 in net profit. Double the revenue by growing the client base without adding proportional overhead, and that margin expands. But most cleaning operators grow by feel — adding cleaners when things feel busy, cutting back when cash gets tight — without a model that shows them exactly where the profit inflection point is.
A cleaning service financial model needs to reflect the two revenue streams that most cleaning businesses run: recurring contracts (the foundation) and one-time or specialty work (the variable layer). Recurring residential and commercial clients provide predictable revenue you can staff around. One-time deep cleans and move-in/move-out jobs are higher-value per visit but require scheduling flexibility and don't compound the way recurring accounts do. The mix matters: a business that's 80% recurring contracts has a very different cash flow profile and growth path than one that's 80% one-time bookings. Modeling each stream separately shows you which side of the business is driving profitability and where adding capacity produces the best return.
Cleaning Service Industry at a Glance
Financial templates built for residential and commercial cleaning businesses — pre-loaded with labor, supplies, and overhead categories, and structured around the recurring contract model most cleaning companies run on.
Revenue Drivers
- Recurring residential contracts
- Commercial cleaning contracts
- One-time deep cleans
- Move-in/move-out cleaning
- Post-construction cleanup
Key Cost Categories
- Labor (wages & payroll taxes)
- Cleaning supplies & chemicals
- Equipment & tools
- Vehicle & transportation
- Liability insurance
- Marketing & advertising
Typical Margins
Gross: 40-55% · Net: 10-20%
Seasonality
Spring (March-April) peaks with spring cleaning demand; back-to-school surge in August-September; summer slightly slower as clients vacation; commercial cleaning demand is relatively steady year-round.
Key Performance Indicators
Cleaning Service Financial Model Template FAQ
More Cleaning Service Templates
Cleaning Service Balance Sheet Template for Excel
$29
Cleaning Service Budget Template for Excel
$29
Cleaning Service Business Plan Template for Excel
$39
Cleaning Service Cash Flow Template for Excel
$29
Cleaning Service Expense Tracker Template for Excel
$29
Cleaning Service Income Statement Template for Excel
$29
Cleaning Service Invoice Template for Excel
$29
Cleaning Service KPI Dashboard Template for Excel
$29
Cleaning Service P&L Template for Excel
$29
Cleaning Service Pro Forma Template for Excel
$29
Cleaning Service Project Budget Template for Excel
$29
Cleaning Service Sales Forecast Template for Excel
$29
Cleaning Service Business Valuation Template for Excel
$29
More Financial Model Templates
Cleaning Service Financial Model Template
$29