Accounting Firm Financial Model Template
Model your accounting firm's revenue by service line, track utilization and realization rates by staff level, and forecast 24 months of P&L and cash flow — built for CPA firms, bookkeeping practices, and advisory firms managing seasonal revenue cycles.
What's Inside This Accounting Firm Financial Model Template
This template includes 6 worksheets, each designed for a specific part of your accounting firm financial workflow:
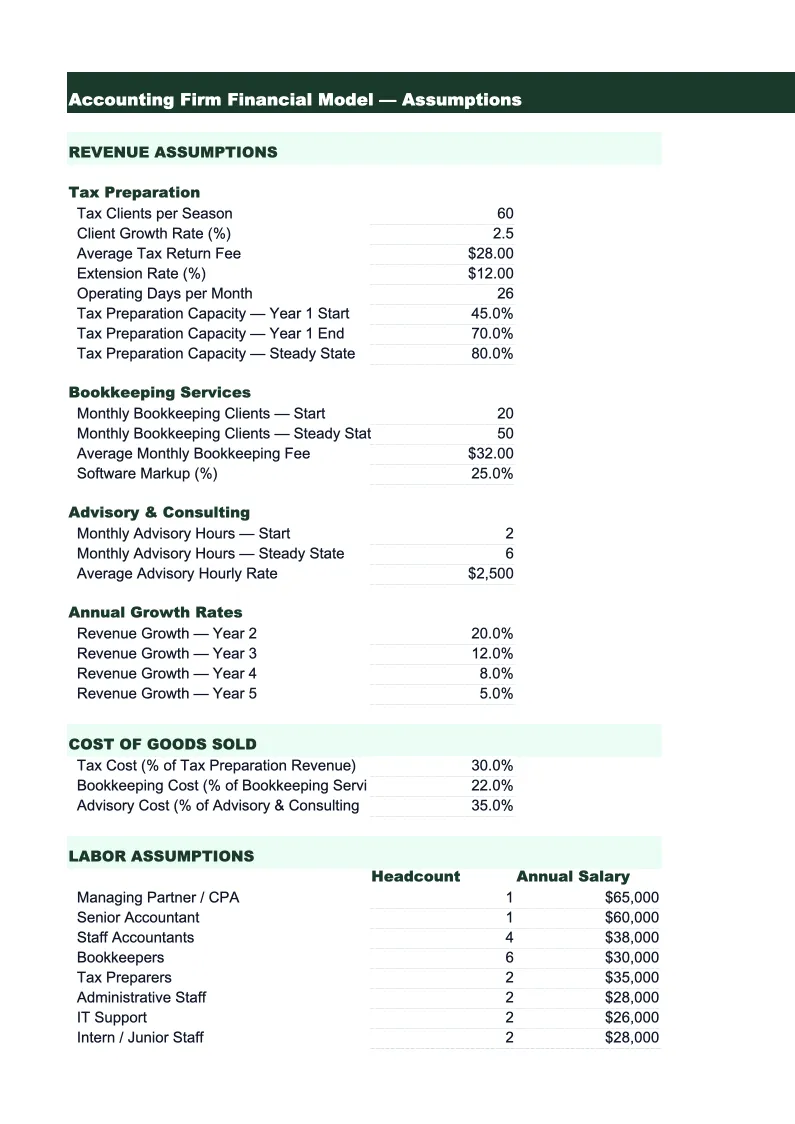
Assumptions
The central input sheet that drives every projection in the model.
Revenue Model
A 24-month revenue projection built by service line and billing structure.
Utilization & Realization
The performance tracking sheet that models the three-stage revenue funnel specific to accounting firm economics: utilization rate (billable hours worked ÷ available hours), realization rate (fees billed ÷ standard rate value of hours worked), and collection rate (cash collected ÷ fees billed).
P&L
A 24-month profit and loss statement structured around accounting firm service lines.
Cash Flow
A monthly cash flow statement that models the timing gap between accounting firm revenue recognition and cash collection.
Dashboard
A one-page visual summary built for partner meetings, bank loan applications, or annual planning sessions.
Accounting Firm Financial Model Template Features
- Revenue model by service line: tax, audit, CAS bookkeeping, advisory, and payroll projected separately with appropriate billing structures
- Three-stage revenue funnel: hours worked → hours billed (realization rate) → cash collected (collection rate)
- Seasonal revenue distribution with busy-season and extension-season capacity modeling
- Utilization tracker by staff level — partner, senior accountant, staff accountant, bookkeeper
- Days Sales Outstanding (DSO) by service line to track collection cycle by billing type
- 24-month P&L with gross and net margin benchmarks displayed alongside projections
How to Use This Accounting Firm Financial Model Spreadsheet
Start in the Assumptions sheet. Enter your staff headcount by level and their billing rates — this is the foundation for every number in the model. If you're an existing firm, pull last year's time records to find your actual billable hours per person and your realized realization rate. Most firms discover their effective realization rate is 5–10 percentage points below what they assumed, which explains the gap between expected and actual revenue. Set your service line mix: what percentage of your revenue comes from tax work, audit, monthly bookkeeping retainers, advisory, and payroll? Then enter your cost structure — staff salaries, E&O premiums, software subscriptions, CPE budget, and overhead. The Assumptions sheet also has seasonality adjustment factors: set the percentage of annual tax revenue that falls in Q1 vs. Q3 based on your client mix of individuals vs. business returns. With those inputs in place, every other sheet in the model populates automatically.
Once assumptions are loaded, review the Revenue Model and P&L sheets. Check that your projected gross margin is in the 50–65% range and that net margin is tracking toward 20–35%. If the numbers look off, the most common culprits are billing rates set below market for your market, a realization rate being dragged down by write-offs on fixed-fee tax returns that consistently run over scope, or a bookkeeping retainer portfolio priced at rates that made sense three years ago but haven't kept pace with staff cost increases. The Cash Flow sheet shows the seasonal pattern clearly: cash piles up in April and May as tax returns are filed and final payments are collected, then runs thin in July and August when billable activity drops. Review the cumulative cash balance line to see whether the firm needs a line of credit to bridge the summer trough, or whether retained earnings from busy season are sufficient.
15 minutes from download to your first accounting firm financial projection
Download the template, plug in your billing rates and headcount, and see your firm's full financial picture — revenue by service line, utilization tracking, seasonal cash flow, and 24-month P&L included.
Why Every Accounting Firm Needs a Financial Model
Accounting firm revenue has an unusual structure compared to most service businesses: a large portion of annual billings is earned in a concentrated window, then the firm lives off that cash for months afterward. Tax preparation revenue for a practice with a typical individual-to-business mix might generate 45–55% of annual revenue between January 15 and April 15. That concentration creates a planning problem — you need enough staff to handle the surge, but those people must be affordable year-round when utilization drops. A financial model that maps revenue by service line and month, rather than treating the year as uniform, is what makes that staffing decision concrete rather than intuitive.
The three KPIs that determine accounting firm profitability are utilization rate, realization rate, and collection rate — and most firms track none of them rigorously. Utilization rate measures how much of available staff time is spent on billable work. Realization rate measures how much of that time actually makes it onto an invoice at full rate, versus being written off because a tax return took longer than the fixed fee allows, or because a bookkeeping client's books required cleanup the retainer doesn't cover. Collection rate measures how much of what's billed is eventually paid. Multiply the three rates together across your staff headcount and billing rates, and you get your effective revenue yield. For most small and mid-size accounting firms, this calculation reveals that the firm is generating 15–25% less revenue per hour of professional time than the billing rate alone would suggest — which is recoverable through better scope management and billing discipline.
Accounting Firm Industry at a Glance
Financial templates built for accounting firms and CPA practices — from solo practitioners to multi-partner firms. Pre-loaded with billable hour tracking, realization rate calculations, and service categories that reflect how accounting firms actually bill.
Revenue Drivers
- Tax preparation and planning
- Audit and assurance
- Bookkeeping and client accounting services (CAS)
- Advisory and fractional CFO services
- Payroll processing
Key Cost Categories
- Professional staff salaries and benefits
- Administrative staff
- Occupancy and rent
- Technology and software (tax, practice management)
- Malpractice (E&O) insurance
- Marketing and business development
- CPE and professional development
- Subcontractors and offshore staff
Typical Margins
Gross: 50-65% · Net: 20-35%
Seasonality
Heavy busy season January through April 15; secondary crunch in September through October 15 for extensions. Slowest months are July and August.
Key Performance Indicators
Accounting Firm Financial Model Template FAQ
More Accounting Firm Templates
Accounting Firm Balance Sheet Template for Excel
$29
Accounting Firm Budget Template for Excel
$29
Accounting Firm Business Plan Template for Excel
$39
Accounting Firm Cash Flow Template for Excel
$29
Accounting Firm Expense Tracker Template for Excel
$29
Accounting Firm Income Statement Template for Excel
$29
Accounting Firm Invoice Template for Excel
$29
Accounting Firm KPI Dashboard Template for Excel
$29
Accounting Firm P&L Template for Excel
$29
Accounting Firm Pro Forma Template for Excel
$29
Accounting Firm Project Budget Template for Excel
$29
Accounting Firm Sales Forecast Template for Excel
$29
Accounting Firm Valuation Template for Excel
$29
More Financial Model Templates
Accounting Firm Financial Model Template
$29