Coffee Shop Financial Model Template
Project revenue by daily drink volume and average ticket, model your beverage cost and labor, and see your cash position month by month — built for coffee shop owners and cafe operators.
What's Inside This Coffee Shop Financial Model Template
This template includes 7 worksheets, each designed for a specific part of your coffee shop financial workflow:
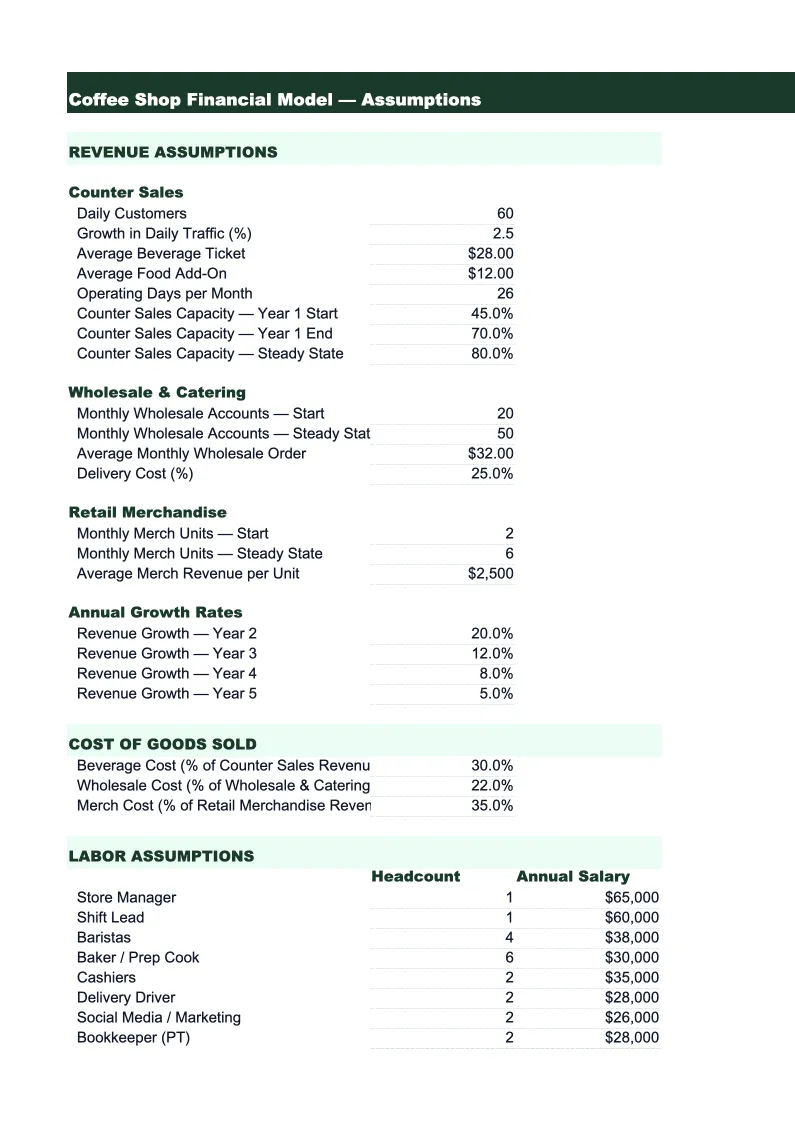
Assumptions
The control panel for the entire model.
Revenue Projections
A 24-month revenue build broken out by stream: espresso and specialty drinks, drip and batch brew coffee, food and pastry sales, retail merchandise (whole bean bags, branded mugs, etc.), wholesale bean sales to restaurants or offices, and catering or event service if applicable.
Beverage & Food Cost
A detailed cost of goods model that tracks beverage cost and food cost separately.
Labor Plan
A month-by-month labor model organized by role: baristas (broken into full-time and part-time), shift supervisors, kitchen or prep staff if you serve food, and an owner-operator or general manager.
P&L
A 24-month profit and loss statement that pulls revenue from the Revenue Projections sheet, COGS from the Beverage & Food Cost sheet, and labor from the Labor Plan.
Cash Flow
A monthly cash flow statement showing opening cash, operating cash inflows, and cash outflows for expenses, equipment, and debt service.
Dashboard
A one-page visual summary built for owner reviews, investor conversations, or a bank loan package.
Coffee Shop Financial Model Template Features
- Daily drink volume revenue model with separate espresso, drip, food, and wholesale projections
- Beverage cost by category: beans, dairy, syrups, packaging, and alternative milks
- Labor plan by role — baristas (FT and PT), shift supervisors, and owner/manager — with payroll tax
- Pre-opening cost schedule for new café launches covering espresso equipment and buildout
- EBITDA and prime-cost-equivalent tracking against café industry benchmarks
- 24-month cash flow with break-even month highlighted automatically
How to Use This Coffee Shop Financial Model Spreadsheet
Start with the Assumptions sheet. Enter your estimated daily customer count — if you have an existing shop, pull it from your POS report for last month. If you're projecting a new location, research foot traffic at the address and use conservative estimates based on comparable cafés in your market. Then enter your average ticket size (for most coffee shops this is $6–$10), your target beverage cost percentage, and your fixed overhead amounts. The entire model recalculates from these inputs, so take your time getting the daily count and average ticket right — they are the two assumptions that drive everything else.
Once your assumptions are set, open the P&L and Cash Flow sheets to pressure-test the numbers. Check whether your modeled beverage cost is landing in the 20–28% range and whether labor is below 40% of revenue. If either number looks off, go back to Assumptions and adjust your cost percentage inputs or staffing plan before finalizing the projections. The Cash Flow sheet is the one to watch if you're opening a new location — it shows the month-by-month cash requirement during the pre-opening period and how many months of operation are needed before cumulative cash flow turns positive.
15 minutes from download to your first café projection
Download the template, enter your daily customer count and average ticket, and see your coffee shop's full financial picture — revenue, beverage cost, labor, cash flow, and break-even month included.
Why Every Coffee Shop Needs a Financial Model
Coffee shops look financially simple from the outside — sell drinks, collect cash, repeat. The reality is that the business model is operationally demanding: high transaction volume at low ticket sizes, labor that has to be staffed for morning rush even when afternoons are slow, and equipment costs (a quality espresso machine, grinder, and brewing setup can run $30,000–$60,000 for a new build) that require financing or a substantial capital reserve. Most coffee shop closures happen not because demand dried up but because the owner ran out of cash before the business reached the daily customer volume needed to sustain overhead. A financial model is the tool that shows you what that target volume looks like before you sign a lease.
The key metrics in a coffee shop financial model are different from other food service businesses. Beverage cost percentage (the coffee industry equivalent of food cost) should run 20–28% of espresso drink revenue — beans typically represent 18–22%, with dairy and syrups adding another 5–8%. Labor runs higher than restaurant norms, often 35–45% of revenue, because of the service-heavy morning format and the difficulty scheduling around a three-to-four hour peak window. The combined beverage cost plus labor — sometimes called the coffee shop prime cost — should be below 65% for a healthy operation. Shops running above that threshold need either more volume, a higher average ticket, or a reduction in labor hours to reach sustainable margins.
Coffee Shop Industry at a Glance
Financial templates built for coffee shops and cafes — from single-location espresso bars to multi-location roasters. Pre-loaded with beverage cost categories, wholesale account structures, and industry KPIs.
Revenue Drivers
- Espresso & specialty drinks
- Drip coffee & batch brew
- Food & pastry sales
- Wholesale bean sales
- Office coffee service accounts
- Catering & event service
Key Cost Categories
- Coffee beans & specialty ingredients (COGS)
- Dairy & alternative milks
- Food/pastry COGS
- Labor
- Rent & occupancy
- Equipment maintenance & repair
- Packaging & supplies
- Marketing
Typical Margins
Gross: 60-70% · Net: 5-15%
Seasonality
Strongest in fall and winter when hot drink demand peaks; slower in summer unless cold brew and iced drink sales are high. Morning rush (6–10am) drives the majority of daily revenue.
Key Performance Indicators
Coffee Shop Financial Model Template FAQ
More Coffee Shop Templates
Coffee Shop Balance Sheet Template for Excel
$29
Coffee Shop Budget Template for Excel
$29
Coffee Shop Business Plan Template for Excel
$39
Coffee Shop Cash Flow Template for Excel
$29
Coffee Shop Expense Tracker Template for Excel
$29
Coffee Shop Income Statement Template for Excel
$29
Coffee Shop Invoice Template for Excel
$29
Coffee Shop KPI Dashboard Template for Excel
$29
Coffee Shop P&L Template for Excel
$29
Coffee Shop Pro Forma Template for Excel
$29
Coffee Shop Project Budget Template for Excel
$29
Coffee Shop Sales Forecast Template for Excel
$29
Coffee Shop Valuation Template for Excel
$29
More Financial Model Templates
Coffee Shop Financial Model Template
$29