Stackrows
Construction Financial Model Template
A
B
C
D
E
F
G
1
Category
Budget
Actual
2
3
4
5
6
7
8
Assumptions
Job Costing
Revenue & Backlog
Labor & Subcontractors
Overhead & G&A
P&L
Cash Flow
KPI Dashboard

Construction Financial Model Template

Model revenue by project, track job costs against budget, and project company-level cash flow — built for general contractors, specialty trades, and construction company owners.

$29Save 6+ hours vs. building a construction financial model from scratch
Instant download after purchase
Works in Excel & Google Sheets
30-day money-back guarantee
.xlsx265 KB8 sheetsUpdated 2026-03-23

What's Inside This Construction Financial Model Template

This template includes 8 worksheets, each designed for a specific part of your construction financial workflow:
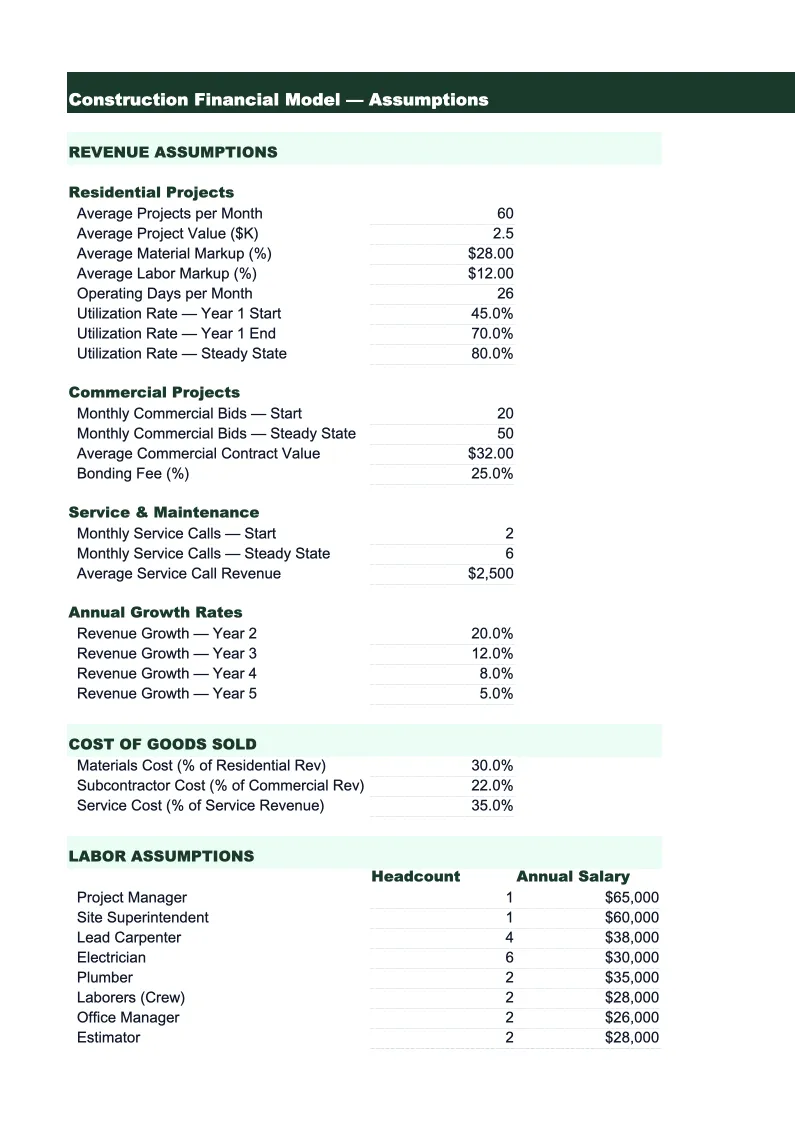
1

Assumptions

The central control sheet for the entire model. Enter your company's key operating parameters: average contract size, number of active projects per month, typical project duration, labor burden rate (the multiplier applied to base wages to account for payroll taxes, workers' comp, benefits, and liability insurance — typically 1.3–1.5x for construction), subcontractor markup percentage, material markup, and overhead cost structure. Also includes inputs for equipment rental rates, bonding and insurance as a percentage of revenue, and office overhead. These inputs drive every output downstream, so you can run scenario analysis quickly: what does taking on two more projects simultaneously do to your cash position? What if material costs increase 8%? What does hiring two additional project managers do to your margin?

2

Job Costing

The core of the model — a project-by-project cost tracking sheet that shows budget vs. actual for up to 20 simultaneous jobs. Each project row shows contract value, start and end date, percentage complete, and estimated vs. actual costs broken into materials, direct labor, subcontractors, equipment, permits and inspections, and project-specific overhead. Gross margin per job is calculated automatically, showing both dollar value and percentage so you can see at a glance which projects are performing and which are running over. Cost variance is highlighted when actual costs exceed budget by more than 5%. This sheet doubles as an ongoing project management tool — update it monthly as projects progress and costs come in to keep your margin forecast accurate throughout the job lifecycle.

3

Revenue & Backlog

A 24-month revenue recognition and backlog schedule. Revenue is modeled by project using percentage-of-completion method — the standard approach for construction revenue recognition under both GAAP and most lender requirements. Each project's monthly recognized revenue is calculated based on its percentage complete and total contract value. The backlog section tracks signed contracts not yet started, projects in progress, and the bid pipeline by probability tier (50%, 75%, 90% probability of award). Total backlog and weighted pipeline are shown each month alongside recognized revenue, giving a forward-looking view of workload. The backlog ratio — months of revenue in backlog — is a key indicator of business health that many construction lenders require in loan reporting packages.

4

Labor & Subcontractors

A detailed breakdown of field labor and subcontractor costs by trade and project category. The labor section shows headcount by crew type (superintendent, foreman, journeyman carpenter, laborer, etc.), base wage rate, hours per month, and fully loaded labor cost including payroll taxes, workers' compensation, general liability allocation, and benefits. This gives you the true cost of a worker on site, not just their hourly wage — a critical distinction for accurate job bidding since labor burden typically adds 30–50% on top of base wages in construction. The subcontractor section tracks sub commitments by trade (concrete, electrical, plumbing, HVAC, framing, drywall, roofing) across active jobs, showing both the contracted amount and the amount invoiced to date so you can track sub payment obligations against your receivable schedule.

5

Overhead & G&A

A monthly detail of all company overhead and general and administrative expenses that are not directly charged to jobs. Categories include: office rent, utilities, and facility costs; office payroll (project managers, estimators, accounting, admin); vehicle fleet costs and fuel; equipment ownership costs (depreciation, maintenance, insurance) for company-owned equipment; software and technology (estimating, project management, accounting); professional services (CPA, attorney, HR); bonding premiums; marketing and business development; and officer compensation. Total overhead per month is shown alongside total field revenue, with overhead as a percentage of revenue calculated automatically — healthy construction companies typically run 8–15% overhead rate. High overhead relative to revenue is often the root cause of thin net margins even on well-priced jobs.

6

P&L

A 24-month income statement built from the job costing, revenue recognition, and overhead sheets. Revenue is shown by project category (new construction, renovation, tenant improvement, service and maintenance), followed by total direct job costs broken into materials, labor, subcontractors, and equipment. Gross profit and gross margin percentage are displayed after direct costs — the most important line for a contractor to track, with healthy range of 20–35% depending on work type. Below gross profit, the sheet deducts company overhead to arrive at operating income, then accounts for interest expense on any equipment loans or credit line to show net income. The model also shows revenue per field employee and revenue per total employee — productivity ratios that owners use to assess whether headcount is keeping pace with revenue or lagging behind.

7

Cash Flow

A monthly cash flow statement that models the timing mismatches that make construction cash management uniquely challenging. The sheet tracks progress billing cycles (most contractors bill on the 25th for work through the 20th and collect 30–45 days later), retainage withheld by the owner (typically 5–10% held until project completion), and the gap between when material purchases and subcontractor payments are due versus when owner payments arrive. Cash outflows include payroll (weekly or biweekly, regardless of billing cycle), material supplier payments (often net-30), sub payments (typically net-30 to net-45), and overhead. The model shows your running cash balance and flags months where cash drops below your minimum threshold. For growing contractors, the cash flow sheet is often the most important output — growing revenue is only valuable if you can fund the work while waiting to get paid.

8

KPI Dashboard

A one-page visual summary of the metrics that construction company owners and their accountants track most closely. Charts included: monthly gross margin percentage vs. target, backlog trend over the forecast period, and revenue by project category mix. Key metrics displayed at the top of the page: current month revenue, gross margin percentage, total active backlog in dollars, months of backlog, bid-to-win ratio, and overhead as a percentage of revenue. A job-level margin summary table shows each active project's contract value, cost to date, percentage complete, and estimated final margin — the equivalent of a mini job cost report in a single view. All metrics pull automatically from the underlying sheets. No additional data entry is required to use the dashboard for an owner review, bank covenant reporting, or bonding agent update.

Construction Financial Model Template Features

  • Project-by-project job costing with budget vs. actual variance tracking for up to 20 simultaneous jobs
  • Percentage-of-completion revenue recognition schedule following GAAP and lender reporting standards
  • Backlog tracking with weighted bid pipeline by probability tier (50%, 75%, 90%) and months-of-backlog calculation
  • Labor burden rate model showing true field labor cost including workers' comp, payroll taxes, and benefits
  • Construction cash flow model accounting for billing cycles, retainage withheld, and payment timing gaps
  • KPI dashboard with gross margin per job, backlog ratio, overhead rate, and bid-to-win ratio

How to Use This Construction Financial Model Spreadsheet

Start with the Assumptions sheet. Enter your labor burden rate — if you don't know yours, 1.35x is a reasonable starting point for a non-union commercial contractor, but calculate it specifically from your actual payroll taxes, workers' comp premium, and benefits cost. Enter your overhead cost structure using last year's actual overhead spend as the baseline, then adjust for any planned hires or cost changes. Set your material and subcontractor markup percentages. Once those inputs are in place, move to the Job Costing sheet and enter your current active projects — contract value, start and end dates, and your initial cost budget by category. This takes 30–45 minutes the first time through and becomes a 10-minute monthly update thereafter.

With your active jobs entered, review the Revenue & Backlog sheet. Enter your signed contracts not yet started and your active bid pipeline with probability estimates. The backlog section will show your months of backlog — if you have less than two months of backlog, that's a signal to increase estimating activity. Review the Cash Flow sheet to understand your near-term cash position, paying attention to months where progress billings and payroll timing create a gap. The single most common cash crisis in construction is a fast-growing company with strong backlog and positive margins that runs out of cash because it's funding new work before old jobs pay. The cash flow sheet shows you that risk in advance.

Use the model monthly throughout the year. After each billing cycle, update the Job Costing sheet with actual costs to date and current percentage complete — the gross margin variance column will immediately show you which jobs are drifting from budget. Update the cash flow actual columns with your bank balance. Review the KPI Dashboard at each monthly owner or management team meeting: gross margin percentage trends, backlog health, and overhead rate are the three indicators that tell the most about company financial health. Construction companies that track job costs monthly and respond to cost overruns early consistently outperform those that only review financials at tax time.

15 minutes from download to your first job cost projection

Download the template, enter your active projects and overhead structure, and see your construction company's full financial picture — gross margin per job, backlog, and cash position included.

Why Every Construction Company Needs a Financial Model

Construction is one of the few industries where you can have strong revenue growth, a full backlog, and positive gross margins — and still run out of cash. The project-based business model creates timing mismatches that don't exist in other industries: you pay for materials and labor weekly, but collect from owners 30–60 days after billing. Retainage withheld by owners ties up 5–10% of contract value until project completion. A company doing $5 million in revenue with 10% retainage has $500,000 sitting in receivables at all times. Without a financial model that shows these timing gaps explicitly, contractors are managing their business off a bank balance — and the bank balance is always a lagging indicator of what's actually happening.

The financial metrics that matter in construction are different from most industries. Gross margin per job — not company-level gross margin — is the fundamental unit of analysis. A 25% gross margin on a well-run commercial project and a 22% gross margin on a residential renovation aren't interchangeable; the risk profiles, payment terms, change order potential, and crew requirements are completely different. Overhead rate as a percentage of revenue tells you whether your indirect cost structure is scaling proportionally with your revenue, or whether you're adding office overhead faster than field production. Backlog in months tells you how much cushion you have before you need new contracts. These are the numbers that construction CFOs, bonding agents, and bank lenders focus on — and they're the numbers this model is built to produce.

For contractors seeking bonding, a line of credit, or SBA financing, the financial model is often the first serious financial document a banker or surety agent reviews. Bonding companies specifically look at working capital (current assets minus current liabilities), equity, and backlog-to-equity ratio when setting bond limits. SBA construction loans require 3-year projections with cash flow detail. A well-built financial model that shows revenue by project category, gross margin by job type, backlog trend, and monthly cash position tells an underwriter that the contractor understands their business — and that perception affects both approval decisions and the cost of capital. This template produces all of those outputs in a format that lenders and bonding agents recognize.

Construction Industry at a Glance

Financial templates built for construction companies — from general contractors to specialty trades. Pre-loaded with job costing categories, bid tracking, and project-based financials.

Revenue Drivers

  • Project contracts
  • Change orders
  • Service & maintenance
  • Material markups

Key Cost Categories

  • Materials
  • Labor (direct)
  • Subcontractors
  • Equipment rental
  • Permits & insurance
  • Overhead

Typical Margins

Gross: 20-35% · Net: 2-7%

Seasonality

Peak activity spring through fall; winter slowdown in northern climates. Year-end push to close projects.

Key Performance Indicators

Gross margin per jobBacklog ratioBid-to-win ratioCost variance per projectRevenue per employee

Construction Financial Model Template FAQ

Construction Financial Model Template

$29