Auto Repair Financial Model Template
Project revenue by service type, model technician labor and parts costs, and see your auto repair shop's 3-year financial picture in one connected workbook.
What's Inside This Auto Repair Financial Model Template
This template includes 6 worksheets, each designed for a specific part of your auto repair financial workflow:
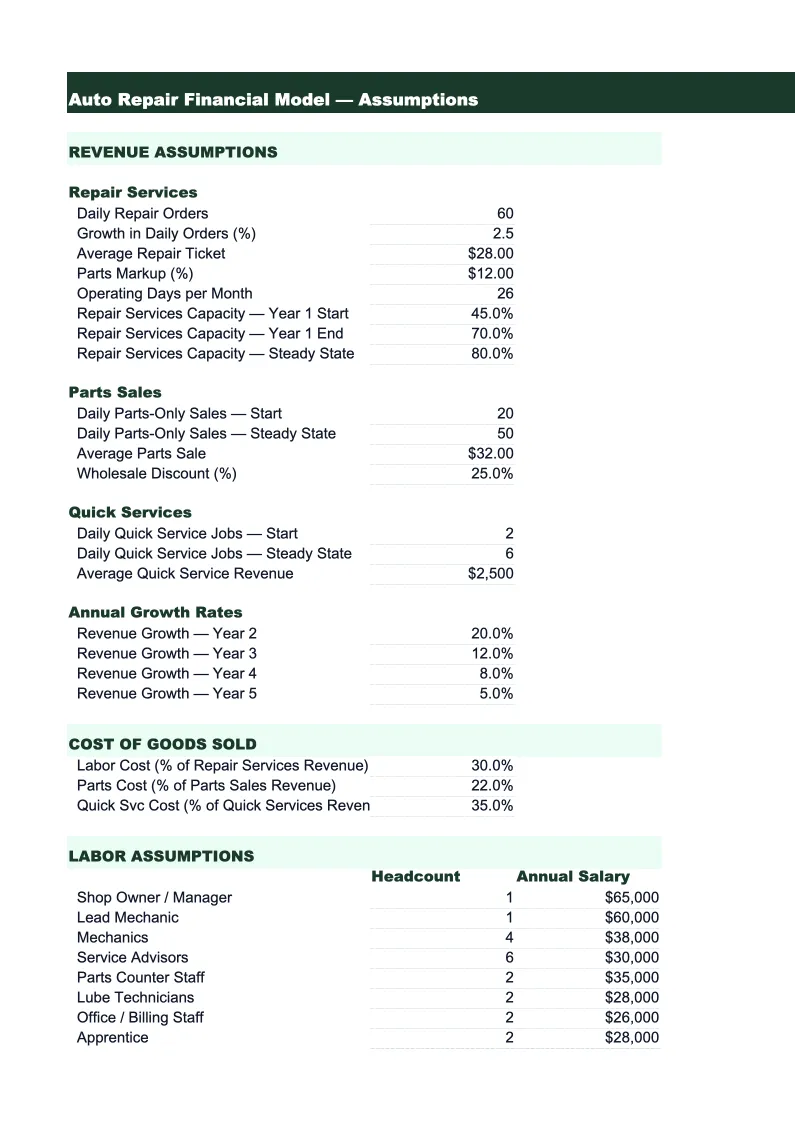
Assumptions
The control panel for the entire model.
Revenue Projections
Monthly revenue breakdown across the core auto repair service categories: general repair labor, oil changes and maintenance, diagnostics and inspections, tire sales, parts sales, and shop supply fees.
Income Statement
A fully-built monthly and annual P&L that follows standard auto repair shop accounting.
Cash Flow Statement
A 36-month cash flow projection covering operating, investing, and financing activities.
Balance Sheet
A projected balance sheet that ties to both the income statement and cash flow statement.
KPI Dashboard
A visual summary of the metrics that drive auto repair shop profitability.
Auto Repair Financial Model Features
- Revenue model by service category: labor, maintenance, diagnostics, tires, and parts
- Technician labor modeling with Effective Labor Rate (ELR) and utilization tracking
- Parts margin calculation tied to COGS — change the margin assumption and the model updates everywhere
- Seasonality weighting built in — reflects spring/summer peaks and January–February slowdowns
- Full 3-statement model: linked P&L, cash flow, and balance sheet
- KPI dashboard: ARO, car count, ELR, technician efficiency, and gross profit per labor hour
How to Use This Auto Repair Shop Financial Spreadsheet
Start with the Assumptions sheet. Enter your number of bays, technician count, target Effective Labor Rate, and weekly car count. These inputs drive everything downstream. If you're building a projection for an existing shop, use last quarter's averages as your baseline — don't try to be precise on day one. If you're projecting for a new shop, use your target capacity at 60–70% utilization, which is a realistic first-year assumption for most markets. The seasonality weights are pre-set to industry norms, but you can adjust them if your market has a different demand pattern.
Once the assumptions are set, review the Revenue Projections sheet to make sure the monthly car counts and revenue figures feel realistic. Then check the Income Statement — verify that your gross margin is landing in the 50–60% range typical for auto repair, and that operating expenses reflect your actual fixed cost structure. If you're planning a buildout or equipment purchase, enter it in the Cash Flow sheet's investing section so the cash balance stays accurate.
15 minutes from download to your first projection
Enter your car count, labor rate, and ARO targets — the model builds your full 3-year financial picture automatically.
Why Auto Repair Shops Need a Financial Model
Auto repair shop finances are driven by two levers that most shop owners don't track formally: Effective Labor Rate (ELR) and Average Repair Order (ARO). ELR is the actual revenue collected per labor hour billed — not the door rate on the board, but what you actually take in after discounts, warranty work, and comebacks. ARO is the average ticket value per vehicle. A shop with 80 cars per week at a $250 ARO generates $20,000 in revenue. The same shop at a $350 ARO generates $28,000 — without changing car count, staff, or overhead. Those two numbers, more than anything else, determine whether an auto repair shop is profitable.
The cost structure in auto repair splits cleanly into two buckets. Variable costs — parts and technician labor — should run 40–50% of revenue combined, leaving a gross margin of 50–60%. That gross margin has to cover all fixed overhead: rent, utilities, insurance, marketing, management salaries, and equipment costs. A shop with $50,000 in monthly revenue and $30,000 in fixed overhead needs at least 60% gross margin to break even. Most shops that struggle financially have a gross margin problem hidden inside a revenue problem — they think they need more car count when they actually need to fix their labor rate or parts pricing.
Auto Repair Industry at a Glance
Financial templates built for auto repair shops — from single-bay independents to multi-location service centers. Pre-loaded with labor, parts, and overhead categories specific to the automotive service industry.
Revenue Drivers
- Labor (repair services)
- Parts sales
- Oil changes & maintenance
- Diagnostics & inspections
- Tire sales
- Shop supplies fees
Key Cost Categories
- Parts & materials (COGS)
- Technician labor
- Rent & occupancy
- Equipment & tools
- Utilities
- Insurance
- Marketing & advertising
- Shop supplies
Typical Margins
Gross: 50-60% · Net: 5-15%
Seasonality
Busiest in summer (June–August) and spring (March–May) for maintenance and travel prep; January–February are consistently the slowest months.
Key Performance Indicators
Auto Repair Financial Model Template FAQ
More Auto Repair Templates
Auto Repair Shop Balance Sheet Template for Excel
$29
Auto Repair Shop Budget Template for Excel
$29
Auto Repair Shop Business Plan Template for Excel
$39
Auto Repair Shop Cash Flow Template for Excel
$29
Auto Repair Expense Tracker Template for Excel
$29
Auto Repair Income Statement Template for Excel
$29
Auto Repair Invoice Template for Excel
$29
Auto Repair KPI Dashboard Template for Excel
$29
Auto Repair P&L Template for Excel
$29
Auto Repair Shop Pro Forma Template for Excel
$29
Auto Repair Shop Project Budget Template for Excel
$29
Auto Repair Sales Forecast Template for Excel
$29
Auto Repair Shop Valuation Template for Excel
$29
More Financial Model Templates
Auto Repair Financial Model Template
$29