Coffee Shop Sales Forecast Template
Project your coffee shop's revenue by drink category, customer count, and season — with driver-based formulas that update automatically as assumptions change.
What's Inside This Coffee Shop Sales Forecast Template
This template includes 5 worksheets, each designed for a specific part of your coffee shop financial workflow:
Assumptions
The control panel for the entire forecast.
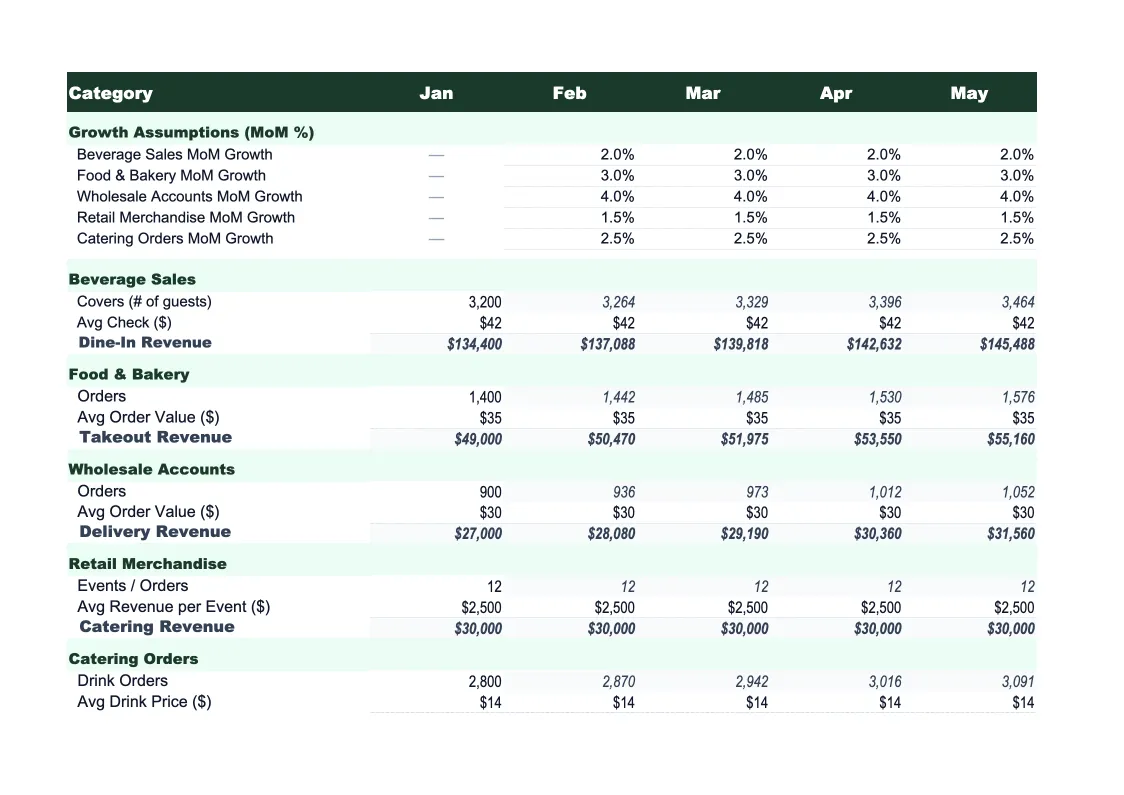
Monthly Forecast
Your month-by-month revenue projection broken out by category: espresso and specialty drinks, drip coffee and batch brew, cold brew and iced drinks, food and pastries, retail whole-bean sales, and wholesale or office account revenue.
Annual Summary
A single-page view of your full-year sales forecast with all 12 months side by side.
Actual vs Forecast
Track what you projected against what your POS actually reported.
Scenario Analysis
Three side-by-side scenarios — base case, upside, and downside — built from the same driver structure as your main forecast.
Coffee Shop Sales Forecast Template Features
- Driver-based model: change daily customer count or ticket size and every projection updates
- Revenue split across espresso drinks, drip, cold brew, food, retail beans, and wholesale
- Monthly seasonality adjustments built into the traffic and mix assumptions
- Actual vs forecast variance tracker with color-coded alerts
- Three-scenario analysis (base, upside, downside) on a single sheet
- Daily and weekly revenue averages calculated for each month
How to Use This Coffee Shop Sales Forecast Spreadsheet
Start with the Assumptions sheet — it drives everything else. Enter your current daily customer count for each month (you can pull this from your POS), your average ticket size for beverages and food separately, and your rough product mix (what percentage of transactions are espresso drinks vs. drip vs. cold brew vs. food). If you have wholesale or office accounts, enter those as a flat monthly revenue figure. The whole model builds from these numbers, so spending 20 minutes getting them right pays off for every sheet downstream.
Once your assumptions are in, the Monthly Forecast and Annual Summary populate automatically. Review the numbers month by month — they should look roughly like your recent actuals, with seasonal variation. Fall and winter months should show stronger espresso and hot drink revenue; summer should show a higher share of cold brew and iced drinks, plus potentially lower overall transaction volume depending on your location and foot traffic patterns. Adjust your mix percentages and seasonal traffic multipliers until the model reflects how your shop actually behaves.
15 minutes from download to your first coffee shop forecast
Enter your daily customer count, average ticket, and product mix — the model projects your full year of revenue automatically.
Why Every Coffee Shop Needs a Sales Forecast
Coffee shops fail at a higher rate than most food service concepts, and the most common reason isn't bad coffee — it's poor revenue visibility. Most operators know their daily sales figure from the POS, but few have a forward-looking view of where revenue is heading month to month. When rent goes up 8% at renewal or a new competitor opens across the street, owners who have a working forecast can model the impact within minutes. Those who don't are making staffing and purchasing decisions based on gut feel.
A coffee shop sales forecast works differently from a generic revenue model because of how granular the revenue drivers are. Beverage cost runs 25–35% of drink revenue, so the mix between a $3.50 drip coffee and a $6.50 oat milk latte matters enormously to profitability — and your forecast should reflect that. Similarly, food attachment rate (the percentage of transactions that include a pastry or sandwich) can swing total revenue by 10–15% without changing customer count at all. Modeling these drivers separately gives you levers to pull, not just a number to stare at.
Coffee Shop Industry at a Glance
Financial templates built for coffee shops and cafes — from single-location espresso bars to multi-location roasters. Pre-loaded with beverage cost categories, wholesale account structures, and industry KPIs.
Revenue Drivers
- Espresso & specialty drinks
- Drip coffee & batch brew
- Food & pastry sales
- Wholesale bean sales
- Office coffee service accounts
- Catering & event service
Key Cost Categories
- Coffee beans & specialty ingredients (COGS)
- Dairy & alternative milks
- Food/pastry COGS
- Labor
- Rent & occupancy
- Equipment maintenance & repair
- Packaging & supplies
- Marketing
Typical Margins
Gross: 60-70% · Net: 5-15%
Seasonality
Strongest in fall and winter when hot drink demand peaks; slower in summer unless cold brew and iced drink sales are high. Morning rush (6–10am) drives the majority of daily revenue.
Key Performance Indicators
Coffee Shop Sales Forecast Template FAQ
More Coffee Shop Templates
Coffee Shop Balance Sheet Template for Excel
$29
Coffee Shop Budget Template for Excel
$29
Coffee Shop Business Plan Template for Excel
$39
Coffee Shop Cash Flow Template for Excel
$29
Coffee Shop Expense Tracker Template for Excel
$29
Coffee Shop Financial Model Template for Excel
$29
Coffee Shop Income Statement Template for Excel
$29
Coffee Shop Invoice Template for Excel
$29
Coffee Shop KPI Dashboard Template for Excel
$29
Coffee Shop P&L Template for Excel
$29
Coffee Shop Pro Forma Template for Excel
$29
Coffee Shop Project Budget Template for Excel
$29
Coffee Shop Valuation Template for Excel
$29
More Sales Forecast Templates
Coffee Shop Sales Forecast Template
$29