Coffee Shop KPI Dashboard Template
Track the numbers that drive coffee shop profitability — average ticket size, cups sold per day, beverage cost %, labor cost %, and wholesale revenue — in one pre-built Excel dashboard.
What's Inside This Coffee Shop KPI Dashboard Template
This template includes 5 worksheets, each designed for a specific part of your coffee shop financial workflow:
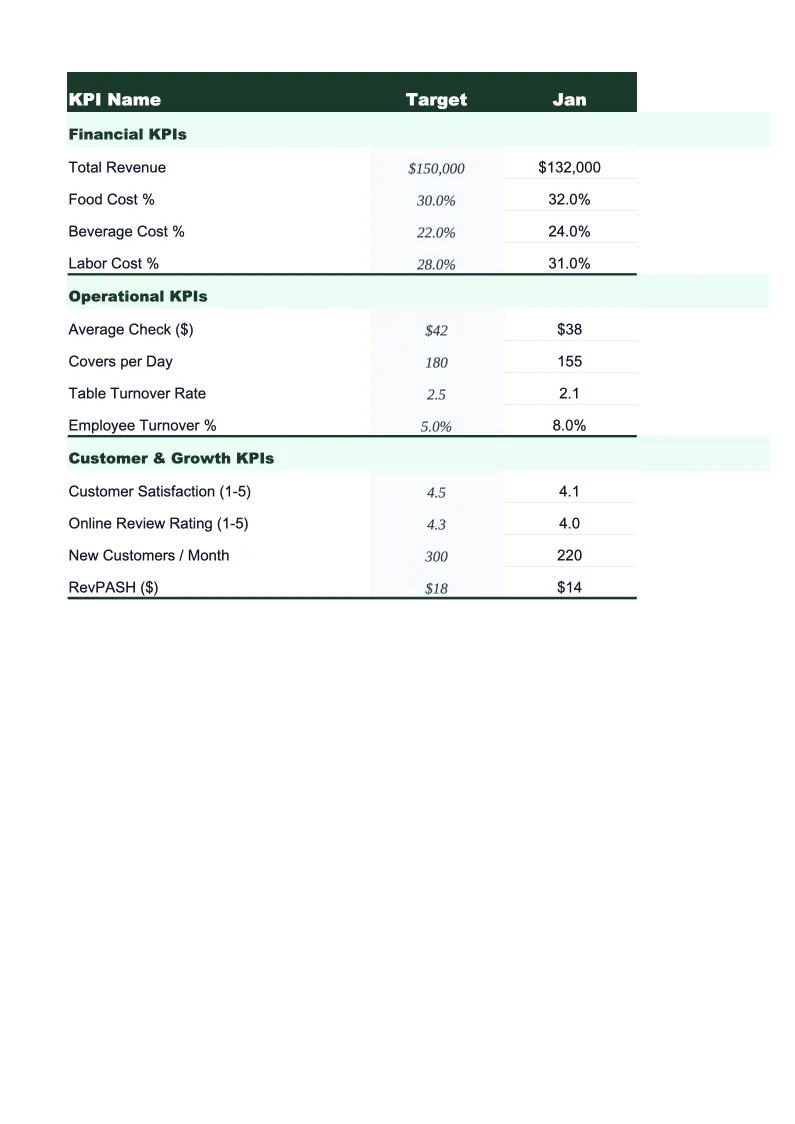
KPI Dashboard
The main overview sheet displaying every critical coffee shop metric at a glance.
Monthly Input
The data entry sheet where you record your coffee shop's operational numbers each month.
Revenue by Category
Breaks total revenue into the channels that drive a coffee shop: espresso and specialty drinks, drip and batch brew, cold brew and iced drinks, food and pastries, merchandise, retail bean sales, wholesale accounts, and office coffee service.
Cost & Labor Tracker
Tracks the two cost lines that coffee shop owners lose the most margin on: beverage cost and labor.
Goals & Benchmarks
Set your annual performance targets for the metrics that matter most to coffee shop operators: total revenue, average ticket size, daily cups sold, beverage cost percentage, labor cost percentage, and gross margin.
Coffee Shop KPI Dashboard Template Features
- Pre-loaded with coffee shop KPIs: average ticket size, daily cups sold, beverage cost %, labor cost %, prime cost %, and gross margin
- Revenue breakdown by category — espresso drinks, drip, cold brew, food, merchandise, wholesale, and office coffee service
- Cost and labor tracker with beverage cost %, food cost %, labor cost %, and combined prime cost % by month
- Monthly trend charts for average ticket, cups per day, beverage cost %, and labor cost %
- Annual goals tracker with year-to-date progress and projected year-end totals by KPI
- Color-coded performance indicators — green when on target, amber or red when behind
How to Use This Coffee Shop KPI Spreadsheet
Start by setting up the Goals & Benchmarks sheet with your targets for the year — total revenue goal, average ticket size you want to hit, daily cups sold target, and your cost percentage ceilings for beverages and labor. If you've been open for at least a few months, use your POS averages as a starting point and adjust for any menu changes or pricing updates you're planning. Then move to the Monthly Input sheet and enter your most recent completed month: total transactions, revenue by category, beverage and food costs from supplier invoices, and labor hours and dollars by role. The first data entry takes about 20 minutes; subsequent months are faster once you know where to pull each number.
Each month, return to the Monthly Input sheet and add the new month's data. The KPI Dashboard, Revenue by Category, Cost & Labor Tracker, and Goals & Benchmarks sheets all update automatically. Pay attention to the prime cost line in the Cost & Labor Tracker — prime cost (beverage cost % plus labor cost %) is the single most important operational number for a coffee shop because those two inputs together account for the majority of variable expenses. If prime cost trends above 65%, you need to identify whether it's a beverage cost problem (over-pouring, waste, supplier price increases) or a labor problem (scheduling inefficiency, too many hours in low-volume periods).
15 minutes from download to your first coffee shop dashboard
Download the template, enter last month's POS data and supplier costs, and see your beverage cost %, labor %, average ticket, and gross margin in one view.
Why Every Coffee Shop Needs a KPI Dashboard
Coffee shops operate on tight margins — gross margins of 60–70% sound healthy until you account for labor, rent, and overhead, which together push net margins down to 5–15% for most independent operators. The difference between a shop that makes money and one that slowly bleeds is almost entirely captured in two numbers: beverage cost percentage and labor cost percentage. Beverage cost above 35% means you're either over-pouring, dealing with significant waste, or your pricing doesn't reflect ingredient costs. Labor cost above 35% usually means your schedule doesn't match your transaction volume — too many hours in slow periods, or too few in the morning rush. Tracking both numbers monthly, not quarterly, is how owner-operators catch these problems while they're still fixable.
Average ticket size is the most controllable revenue lever for most coffee shops. A shop doing 200 transactions per day at a $6.00 average ticket generates $36,000 per month. The same transaction count at $7.50 generates $45,000 — a 25% revenue increase with no change in foot traffic or labor hours. The difference comes from food attachment rates, successful upsells to larger sizes or add-ons, and menu engineering that promotes higher-margin items. Wholesale and office coffee service accounts add a layer of revenue that smooths the daily variability of retail — even a handful of wholesale accounts at $500–$1,500/month each can materially stabilize cash flow. A KPI dashboard that tracks revenue by category makes it easy to see how these contributions are trending rather than lumping everything into a single revenue line.
Coffee Shop Industry at a Glance
Financial templates built for coffee shops and cafes — from single-location espresso bars to multi-location roasters. Pre-loaded with beverage cost categories, wholesale account structures, and industry KPIs.
Revenue Drivers
- Espresso & specialty drinks
- Drip coffee & batch brew
- Food & pastry sales
- Wholesale bean sales
- Office coffee service accounts
- Catering & event service
Key Cost Categories
- Coffee beans & specialty ingredients (COGS)
- Dairy & alternative milks
- Food/pastry COGS
- Labor
- Rent & occupancy
- Equipment maintenance & repair
- Packaging & supplies
- Marketing
Typical Margins
Gross: 60-70% · Net: 5-15%
Seasonality
Strongest in fall and winter when hot drink demand peaks; slower in summer unless cold brew and iced drink sales are high. Morning rush (6–10am) drives the majority of daily revenue.
Key Performance Indicators
Coffee Shop KPI Dashboard Template FAQ
More Coffee Shop Templates
Coffee Shop Balance Sheet Template for Excel
$29
Coffee Shop Budget Template for Excel
$29
Coffee Shop Business Plan Template for Excel
$39
Coffee Shop Cash Flow Template for Excel
$29
Coffee Shop Expense Tracker Template for Excel
$29
Coffee Shop Financial Model Template for Excel
$29
Coffee Shop Income Statement Template for Excel
$29
Coffee Shop Invoice Template for Excel
$29
Coffee Shop P&L Template for Excel
$29
Coffee Shop Pro Forma Template for Excel
$29
Coffee Shop Project Budget Template for Excel
$29
Coffee Shop Sales Forecast Template for Excel
$29
Coffee Shop Valuation Template for Excel
$29
More KPI Dashboard Templates
Coffee Shop KPI Dashboard Template
$29