Consulting Income Statement Template
Report your consulting firm's revenue and expenses with an income statement built around how consultants actually bill — project fees, retainers, hourly work, and expense reimbursements — with project profitability tracking built in.
What's Inside This Consulting Income Statement Template
This template includes 4 worksheets, each designed for a specific part of your consulting financial workflow:
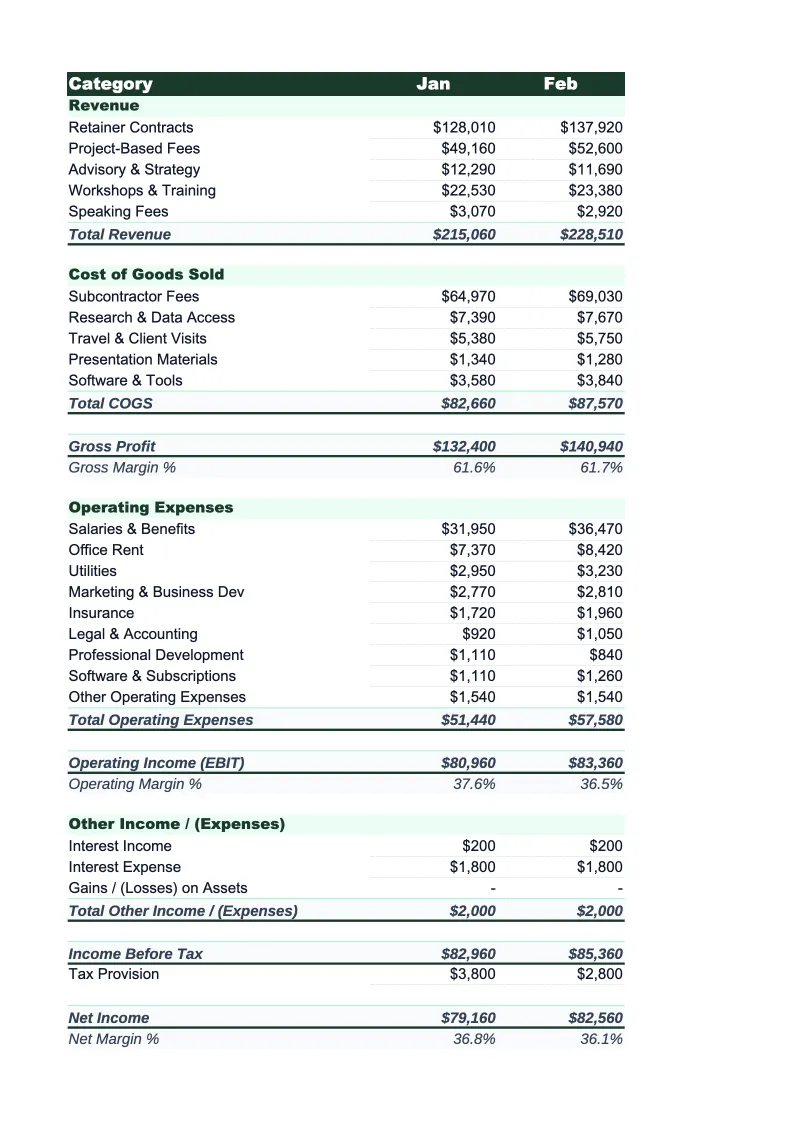
Monthly Income Statement
The core worksheet where you record each month's revenue and expenses using consulting-specific line items.
Annual Summary
A 12-month rollup that aggregates data from each monthly income statement automatically.
Project Profitability
A worksheet for tracking income and direct costs at the individual project or client level.
Dashboard
A one-page visual summary with pre-built charts covering revenue by billing type, gross margin trend by month, operating expense breakdown, and net income across the year.
Consulting Income Statement Template Features
- Revenue split by billing type: hourly, fixed-fee projects, retainers, and expense reimbursements
- Cost of services tracking for subcontractors, direct project costs, and billable travel
- Project profitability sheet with gross margin and effective hourly rate per engagement
- Gross margin, net margin, and billable utilization rate auto-calculations
- 12-month annual rollup with Q1/Q4 seasonality tracking built in
- Visual dashboard with revenue stream breakdown, margin trends, and key consulting KPIs
How to Use This Consulting Income Statement Spreadsheet
Getting started takes about 15 minutes. Download the .xlsx file and open it in Excel or Google Sheets — no macros or plugins required. Start with the Monthly Income Statement sheet and review the pre-loaded revenue and expense categories. Most consulting firms keep the core structure and adjust a handful of line items to match their specific billing model — for instance, splitting retainer revenue by client tier, adding a line for training or workshop revenue, or breaking out subcontractor costs by project type.
Once the categories match your business, enter revenue and expenses for the current month. If you don't track project costs in real time, pull your bank statements, contractor invoices, and billing records and work through each category. The Project Profitability sheet is where you'll spend the most setup time — enter each active engagement, its billed revenue, and direct costs. Everything rolls up to gross profit and net income in the main monthly sheet automatically. Copy the monthly structure forward and fill it in as the year progresses.
15 minutes from download to your first income statement
Download the template, enter your project revenue and contractor costs, and see your consulting firm's gross margin, net income, and project profitability in one place.
Why Every Consulting Firm Needs an Income Statement
Consulting income statements look deceptively simple on the surface — you bill clients, pay contractors, and keep the rest — but the structure that actually drives profitability is more nuanced than that. Consulting revenue is lumpy and delayed: projects close in Q4, work starts in Q1, and invoices go out 30–60 days later. Retainer clients provide predictable monthly cash flow, but fixed-fee projects introduce risk if scope expands without a corresponding fee adjustment. Without a proper income statement that separates these revenue streams, it's very easy to confuse revenue growth with margin improvement — and to miss the moment when subcontractor costs or business development spending starts quietly compressing net income.
The two numbers that matter most in a consulting income statement are gross margin and net margin. Gross margin — revenue minus direct cost of services like subcontractor fees, direct project expenses, and billable travel — should typically fall between 50% and 80% depending on how much of the work you deliver yourself versus sub out. Solo consultants who do all their own work often run gross margins above 80%; firms that rely heavily on subcontractors or junior staff will run lower, typically 50–65%. Net margin, after all operating expenses, typically lands between 20% and 40% for a well-run firm. If your net margin is consistently below 15%, it usually means either that your billing rates are too low or that overhead — software, marketing, and administrative costs — has scaled faster than revenue.
Consulting Industry at a Glance
Financial templates built for consulting firms and independent consultants. Pre-loaded with billing structures for hourly, retainer, and project-based engagements.
Revenue Drivers
- Hourly billing
- Monthly retainers
- Fixed-fee project work
- Expense reimbursements
Key Cost Categories
- Contractor/subcontractor fees
- Travel and accommodation
- Software and tools
- Professional development
- Marketing and business development
- Office and administrative overhead
Typical Margins
Gross: 50-80% · Net: 20-40%
Seasonality
Q1 tends to be slow as clients finalize budgets; Q4 often sees a surge in project closes. Summer can dip for firms serving corporate clients.
Key Performance Indicators
Consulting Income Statement Template FAQ
More Consulting Templates
Consulting Balance Sheet Template for Excel
$29
Consulting Budget Template for Excel
$29
Consulting Business Plan Template for Excel
$39
Consulting Cash Flow Template for Excel
$29
Consulting Expense Tracker Template for Excel
$29
Consulting Financial Model Template for Excel
$29
Consulting Invoice Template for Excel
$29
Consulting KPI Dashboard Template for Excel
$29
Consulting P&L Template for Excel
$29
Consulting Pro Forma Template for Excel
$29
Consulting Project Budget Template for Excel
$29
Consulting Sales Forecast Template for Excel
$29
Consulting Business Valuation Template for Excel
$29
More Income Statement Templates
Accounting Firm Income Statement Template for Excel
$29
Auto Repair Income Statement Template for Excel
$29
Car Wash Income Statement Template for Excel
$29
Church Income Statement Template for Excel
$29
Cleaning Service Income Statement Template for Excel
$29
Coffee Shop Income Statement Template for Excel
$29
Consulting Income Statement Template
$29