Consulting Financial Model Template
Model billable utilization, forecast revenue across hourly, retainer, and project engagements, and see your consulting firm's cash position month by month — built for solo consultants and small firms planning their next year.
What's Inside This Consulting Financial Model Template
This template includes 6 worksheets, each designed for a specific part of your consulting financial workflow:
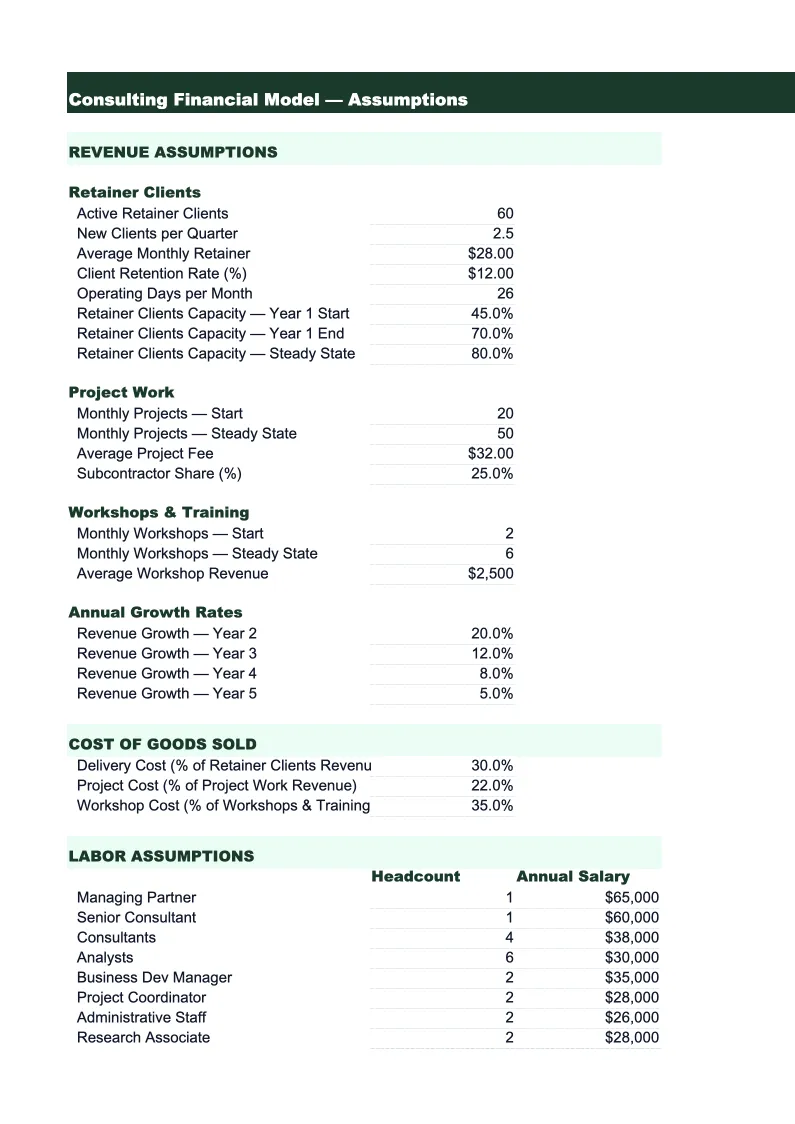
Assumptions
The single input sheet that drives every calculation in the model.
Revenue Projections
A 24-month revenue build organized by billing structure: hourly engagements (consultant hours × billing rate × utilization), monthly retainers (number of retainer clients × average retainer value), and fixed-fee projects (projected project count × average project size).
Utilization & Headcount
A month-by-month view of your firm's capacity and how much of it you're converting to billable revenue.
P&L
A 24-month profit and loss statement that pulls revenue from the Revenue Projections sheet and expenses from your Assumptions inputs.
Cash Flow
A monthly cash flow statement that accounts for the gap between when consulting work is billed and when payment is actually collected.
Dashboard
A one-page visual summary designed for annual planning sessions, bank reviews, or presenting to a potential partner or investor.
Consulting Financial Model Template Features
- Revenue model split by billing structure: hourly, retainer, and fixed-fee engagements projected separately
- Utilization and headcount tracker — billable hours vs. capacity, with planned hire date modeling
- Effective hourly rate calculation across all engagement types
- Accounts receivable timing in cash flow — models 30–60 day collection lag for invoice-based clients
- Seasonal multipliers pre-set for Q1 budget freeze slowdowns and Q4 end-of-year close surge
- 24-month P&L with gross and net margin benchmarks displayed alongside your projections
How to Use This Consulting Financial Model Spreadsheet
Start in the Assumptions sheet. Enter your current headcount, target billable utilization rate, and billing rates for each engagement type — hourly, retainer, and fixed-fee. If you're an existing firm, use last year's actuals as a baseline: look at your invoices and calculate what percentage of client work was each type, your average billing rate across the year, and what your actual utilization rate was (billable hours ÷ total available hours). If you're modeling a new practice, start with conservative utilization — 50–60% in year one is realistic for most consultants — and your current inquiry pipeline to estimate project count and size. Then enter your costs: contractor fees, software subscriptions, travel budget, and overhead. The Utilization & Headcount sheet will immediately show whether your revenue targets are achievable with your current capacity.
Once your assumptions look right, review the Revenue Projections and P&L sheets. Check whether your projected gross margin is in the 50–80% range typical for consulting firms. If it's lower, look at whether contractor costs are eating into project margins, or whether your billing rates are below market for your service type. The Cash Flow sheet is critical if you invoice on net-30 or net-60 terms — it shows what your actual bank balance looks like each month, separate from what you've billed. Firms that look profitable on the P&L but run cash-flow problems usually discover this is the culprit: strong billings, slow collections, and payroll going out every two weeks regardless.
15 minutes from download to your first consulting business projection
Download the template, plug in your billing rates and utilization targets, and see your consulting firm's full financial picture — revenue by engagement type, utilization tracking, cash flow, and 24-month P&L included.
Why Every Consulting Firm Needs a Financial Model
Consulting firms run on two numbers: utilization rate and effective hourly rate. Get both right and the business is highly profitable. Let either one slip and the margins compress fast, because the cost base — consultant salaries, benefits, overhead — is largely fixed while revenue depends entirely on getting client work out the door. Most consultants track these numbers intuitively, but without a model it's hard to see how a 10-point drop in utilization or a single low-rate engagement affects the year. A financial model makes those tradeoffs visible before you're looking at them in hindsight.
The billing structure mix matters more than most consultants realize. Hourly engagements give you flexibility but expose you to scope creep and collection delays. Retainers provide predictable monthly cash flow but require the right client relationship to sustain. Fixed-fee projects can be highly profitable if scoped tightly, or margin killers if they overrun. A model that separates revenue by engagement type lets you see whether you're building a stable recurring revenue base or relying too heavily on lumpy project work. Most healthy consulting firms aim for at least 30–40% of revenue from retainers — enough to cover fixed costs before any project revenue lands.
Consulting Industry at a Glance
Financial templates built for consulting firms and independent consultants. Pre-loaded with billing structures for hourly, retainer, and project-based engagements.
Revenue Drivers
- Hourly billing
- Monthly retainers
- Fixed-fee project work
- Expense reimbursements
Key Cost Categories
- Contractor/subcontractor fees
- Travel and accommodation
- Software and tools
- Professional development
- Marketing and business development
- Office and administrative overhead
Typical Margins
Gross: 50-80% · Net: 20-40%
Seasonality
Q1 tends to be slow as clients finalize budgets; Q4 often sees a surge in project closes. Summer can dip for firms serving corporate clients.
Key Performance Indicators
Consulting Financial Model Template FAQ
More Consulting Templates
Consulting Balance Sheet Template for Excel
$29
Consulting Budget Template for Excel
$29
Consulting Business Plan Template for Excel
$39
Consulting Cash Flow Template for Excel
$29
Consulting Expense Tracker Template for Excel
$29
Consulting Income Statement Template for Excel
$29
Consulting Invoice Template for Excel
$29
Consulting KPI Dashboard Template for Excel
$29
Consulting P&L Template for Excel
$29
Consulting Pro Forma Template for Excel
$29
Consulting Project Budget Template for Excel
$29
Consulting Sales Forecast Template for Excel
$29
Consulting Business Valuation Template for Excel
$29
More Financial Model Templates
Consulting Financial Model Template
$29