Consulting KPI Dashboard Template
Monitor every number that drives consulting profitability — billable utilization, effective hourly rate, revenue per consultant, and project margins — in one pre-built Excel dashboard.
What's Inside This Consulting KPI Dashboard Template
This template includes 5 worksheets, each designed for a specific part of your consulting financial workflow:
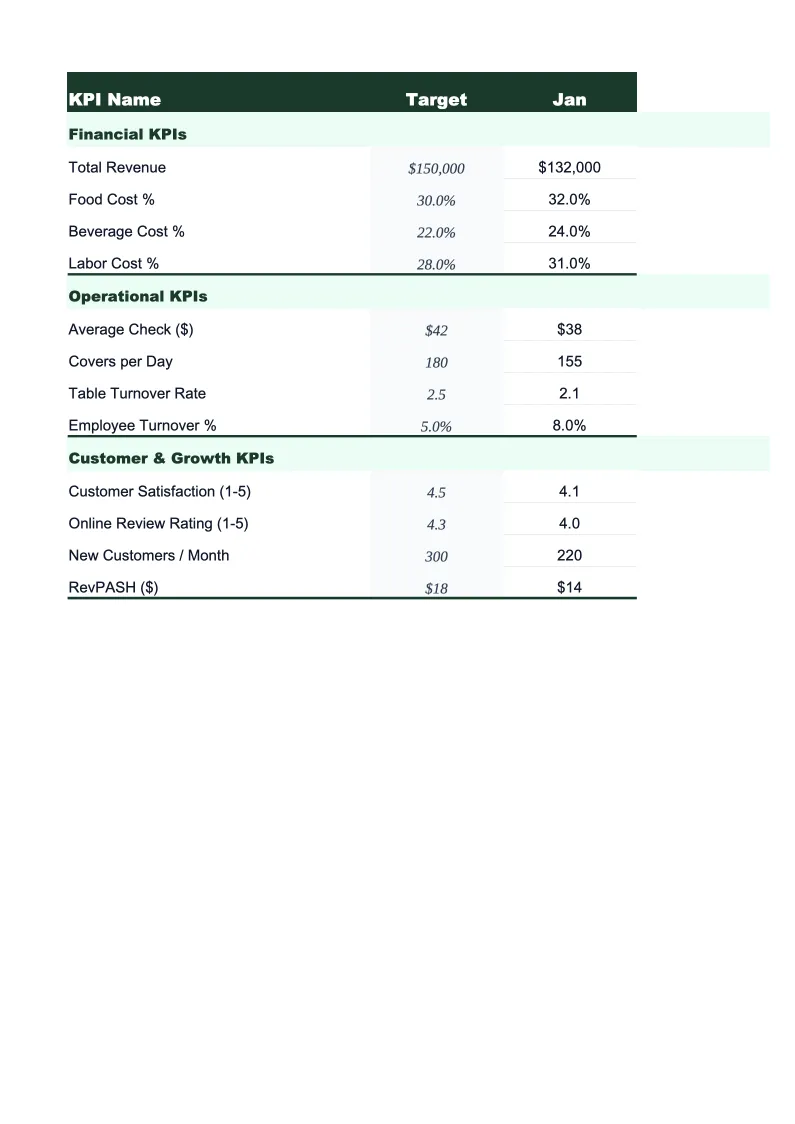
KPI Dashboard
The main overview sheet displaying all critical consulting metrics at a glance.
Monthly Input
The data entry sheet where you record your consulting firm's numbers each month.
Project Tracker
Tracks profitability at the individual project or client level across the year.
Revenue by Engagement Type
Breaks your consulting income into the billing models that drive your business: hourly billing, monthly retainers, fixed-fee project work, and expense reimbursements.
Goals & Benchmarks
Set your annual targets for the metrics that matter most to a consulting firm: total revenue, billable utilization rate, effective hourly rate, revenue per consultant, and net margin.
Consulting KPI Dashboard Template Features
- Pre-loaded with consulting KPIs: billable utilization rate, effective hourly rate, revenue per consultant, and project margin
- Project-level profitability tracker with hours variance and billing realization by engagement
- Revenue breakdown by engagement type — hourly, retainer, fixed-fee, and expense reimbursements
- Monthly trend charts for revenue, utilization, and gross margin
- Annual goals tracker with year-to-date progress and projected year-end totals
- Color-coded performance indicators — green when on target, red when behind
How to Use This Consulting KPI Spreadsheet
Start by setting up the Goals & Benchmarks sheet with your annual targets — total revenue, target billable utilization rate, effective hourly rate goal, and net margin. These don't need to be precise on day one; rough targets are better than none, and you can refine them after two or three months of actual data. Then move to the Monthly Input sheet and enter your numbers for the most recent completed month. You'll need your time tracking reports, invoices or billing records, and a basic expense summary. The entry process takes about 10–15 minutes.
Each month, return to the Monthly Input sheet and add a new row of data. The KPI Dashboard, Revenue by Engagement Type, and Goals & Benchmarks sheets all update automatically. The Project Tracker is worth updating whenever you close a project or at the end of each month — enter the hours spent and revenue collected for each active engagement, and the sheet will flag which projects are over budget on time and which clients are your highest-margin work. Most consultants find this is the sheet that most directly changes how they price and scope future work.
15 minutes from download to your first consulting dashboard
Download the template, enter last month's numbers, and see your billable utilization, effective hourly rate, and project margins in one view.
Why Every Consulting Firm Needs a KPI Dashboard
Most consultants have a general sense of whether they're having a good month or a bad one, but few track the numbers that explain why. Billable utilization rate — the percentage of available working hours that are billed to clients — is the single most important operational metric for a consulting firm. At 60–65% utilization, most solo consultants and small firms break even comfortably. At 70–80%, they're generating strong margins. Below 50%, even high hourly rates struggle to produce a healthy net income. Without tracking utilization consistently, it's easy to stay busy on non-billable work without realizing how much revenue that's costing.
Effective hourly rate and project margin are the two metrics that reveal whether your pricing is working. Effective hourly rate accounts for all the hours that go into a project — preparation, revisions, client calls, project management — not just the hours you bill. A consultant billing $200/hour on a fixed-fee project who routinely does 30% more hours than estimated is actually earning $140/hour. Tracking effective hourly rate by project type over time shows which engagements are systematically underpriced and should be scoped more conservatively or priced higher. Project margin by client shows which relationships are genuinely profitable and which consume time disproportionate to revenue.
Consulting Industry at a Glance
Financial templates built for consulting firms and independent consultants. Pre-loaded with billing structures for hourly, retainer, and project-based engagements.
Revenue Drivers
- Hourly billing
- Monthly retainers
- Fixed-fee project work
- Expense reimbursements
Key Cost Categories
- Contractor/subcontractor fees
- Travel and accommodation
- Software and tools
- Professional development
- Marketing and business development
- Office and administrative overhead
Typical Margins
Gross: 50-80% · Net: 20-40%
Seasonality
Q1 tends to be slow as clients finalize budgets; Q4 often sees a surge in project closes. Summer can dip for firms serving corporate clients.
Key Performance Indicators
Consulting KPI Dashboard Template FAQ
More Consulting Templates
Consulting Balance Sheet Template for Excel
$29
Consulting Budget Template for Excel
$29
Consulting Business Plan Template for Excel
$39
Consulting Cash Flow Template for Excel
$29
Consulting Expense Tracker Template for Excel
$29
Consulting Financial Model Template for Excel
$29
Consulting Income Statement Template for Excel
$29
Consulting Invoice Template for Excel
$29
Consulting P&L Template for Excel
$29
Consulting Pro Forma Template for Excel
$29
Consulting Project Budget Template for Excel
$29
Consulting Sales Forecast Template for Excel
$29
Consulting Business Valuation Template for Excel
$29
More KPI Dashboard Templates
Consulting KPI Dashboard Template
$29