Auto Repair Sales Forecast Template
Forecast auto repair revenue by car count, service mix, and technician capacity — built for independent shops and multi-bay service centers tracking labor, parts, and maintenance revenue separately.
What's Inside This Auto Repair Sales Forecast Template
This template includes 7 worksheets, each designed for a specific part of your auto repair financial workflow:
Assumptions
The central input sheet that drives every projection in the model.
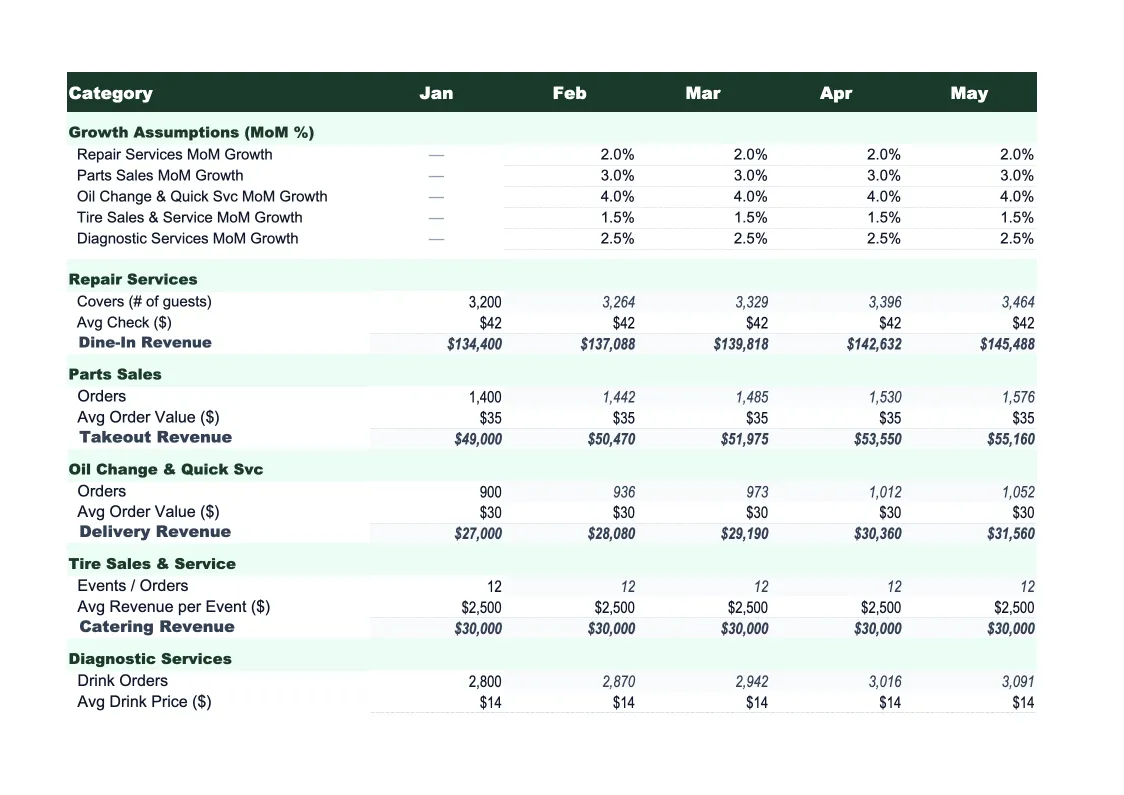
Service Mix Forecast
Revenue broken down by the five main service categories auto shops operate: routine maintenance (oil changes, filters, fluid services), diagnostics and inspections, mechanical repairs (brakes, suspension, drivetrain), tire sales and installation, and shop supplies fees.
Car Count Projection
Month-by-month car count forecast built from two components: returning customers (modeled as a retention rate applied to your current active customer base) and new customers (modeled as a monthly acquisition count from marketing and referrals).
Capacity Analysis
Technician capacity analysis that validates your revenue forecast against available labor hours.
Actuals vs Forecast
Month-by-month comparison of actual revenue against your forecast, broken out by labor revenue, parts revenue, and total revenue.
Scenario Planner
Three independent revenue scenarios — base case, upside, and downside — with separate assumption sets for each.
Dashboard
Visual summary with pre-built charts showing monthly revenue by service category, car count trend vs target, ARO trend, and technician capacity utilization.
Auto Repair Sales Forecast Template Features
- Car count projection model with new and returning customer segments
- Service mix breakdown: maintenance, repairs, tires, diagnostics, and shop supplies
- Technician capacity check to validate forecast against available labor hours
- Average Repair Order (ARO) auto-calculation and target tracking
- Three-scenario planner: base, upside, and downside
- Actuals vs forecast variance tracker with color-coded alerts
How to Use This Auto Repair Sales Forecast Spreadsheet
Start with the Assumptions sheet. Download the file and open it in Excel or upload it to Google Sheets. Enter your bay count, technician headcount, effective labor rate, target daily billable hours per tech, and current monthly car count. If you're not sure about your effective labor rate, pull your last three months of invoices and divide total labor revenue by total billed hours — that number is your baseline. Apply seasonality adjustments if you know your shop runs slower in January and February; the template has those fields built in so your monthly projection reflects the real shape of your year rather than a flat line.
Once the assumptions are set, work through the Service Mix Forecast and Car Count Projection sheets. In the service mix sheet, enter your current volume and average ticket for each service category — oil changes, repairs, tires, diagnostics — so the model knows where your revenue is coming from today. In the car count sheet, enter your current active customer base and a realistic new customer acquisition number. Then open the Capacity Analysis sheet and verify that your revenue forecast is actually achievable with your current team. If the implied utilization rate exceeds 90%, either the forecast is too aggressive or you need to plan a hire before that revenue can materialize.
15 minutes from download to your first auto repair forecast
Download the template, enter your car count, service mix, and technician hours, and get a complete revenue forecast with capacity analysis and scenario planning ready to use.
Why Auto Repair Shops Need a Purpose-Built Sales Forecast
Auto repair shops have a revenue structure that most generic forecasting tools handle poorly. Labor and parts are two distinct revenue streams that move differently — labor scales with technician capacity and efficiency, while parts revenue depends on job mix, parts availability, and how aggressively service advisers are presenting repair options. A shop with three technicians running at 75% efficiency and a $85 effective labor rate has a calculable labor revenue ceiling for the month. Most shop owners know their rough car count and average ticket but don't know whether that translates to the revenue they're projecting — and the gap often doesn't show up until month-end when it's too late to act.
Car count is the heartbeat metric of an auto repair forecast, but ARO is what separates profitable shops from busy-but-struggling ones. Industry benchmarks put the national average ARO for independent shops around $350–$450, but shops focusing on higher-value work — transmissions, engines, ADAS calibration — consistently run $600–$800 ARO with fewer cars and higher margins. A forecast that tracks only car count gives you one lever. A forecast that tracks both car count and ARO by service category gives you visibility into whether growth is coming from selling more services per visit, attracting higher-value jobs, or just running more volume — three very different scenarios with different margin implications.
Auto Repair Industry at a Glance
Financial templates built for auto repair shops — from single-bay independents to multi-location service centers. Pre-loaded with labor, parts, and overhead categories specific to the automotive service industry.
Revenue Drivers
- Labor (repair services)
- Parts sales
- Oil changes & maintenance
- Diagnostics & inspections
- Tire sales
- Shop supplies fees
Key Cost Categories
- Parts & materials (COGS)
- Technician labor
- Rent & occupancy
- Equipment & tools
- Utilities
- Insurance
- Marketing & advertising
- Shop supplies
Typical Margins
Gross: 50-60% · Net: 5-15%
Seasonality
Busiest in summer (June–August) and spring (March–May) for maintenance and travel prep; January–February are consistently the slowest months.
Key Performance Indicators
Auto Repair Sales Forecast Template FAQ
More Auto Repair Templates
Auto Repair Shop Balance Sheet Template for Excel
$29
Auto Repair Shop Budget Template for Excel
$29
Auto Repair Shop Business Plan Template for Excel
$39
Auto Repair Shop Cash Flow Template for Excel
$29
Auto Repair Expense Tracker Template for Excel
$29
Auto Repair Financial Model Template for Excel
$29
Auto Repair Income Statement Template for Excel
$29
Auto Repair Invoice Template for Excel
$29
Auto Repair KPI Dashboard Template for Excel
$29
Auto Repair P&L Template for Excel
$29
Auto Repair Shop Pro Forma Template for Excel
$29
Auto Repair Shop Project Budget Template for Excel
$29
Auto Repair Shop Valuation Template for Excel
$29
More Sales Forecast Templates
Auto Repair Sales Forecast Template
$29