Cleaning Service Sales Forecast Template
Forecast your cleaning company's revenue from recurring residential and commercial contracts, one-time deep cleans, and specialty jobs — with month-by-month projections, client retention modeling, and scenario planning built in.
What's Inside This Cleaning Service Sales Forecast Template
This template includes 7 worksheets, each designed for a specific part of your cleaning service financial workflow:
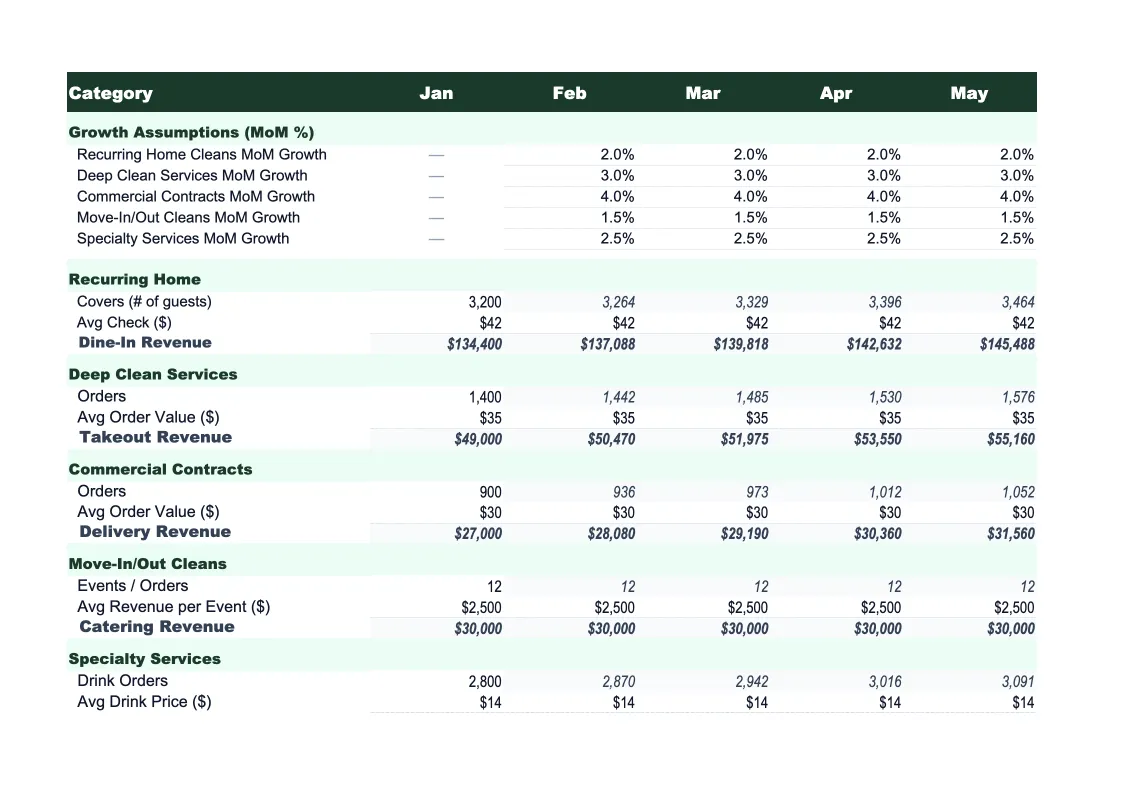
Revenue Drivers
The assumptions sheet where you define the inputs that drive your entire forecast.
Recurring Client Roster
A detailed ledger of your active recurring clients — the most important revenue asset in a cleaning business.
One-Time Jobs Pipeline
A running log of non-recurring jobs: post-construction cleanups, move-in and move-out cleans, event venue cleaning, deep-clean requests from new clients or referrals, and any other one-time or project-based work.
Monthly Forecast
The full 12-month revenue projection combining recurring contract revenue from the Client Roster and weighted one-time job revenue from the One-Time Jobs Pipeline, layered on top of the acquisition and attrition assumptions from the Revenue Drivers sheet.
Actual vs Forecast
Enter your actual monthly revenue by category after each month closes and the sheet calculates variance — dollar difference and percentage — against the projection.
Scenario Comparison
Three side-by-side revenue scenarios — base, upside, and downside — built from different client retention rates, new client acquisition rates, and average visit revenue assumptions.
Dashboard
A visual one-page summary with pre-built charts: monthly projected revenue split by residential recurring, commercial recurring, and one-time jobs (stacked bar); active client count trend over 12 months; actual vs forecast variance for the trailing six months; and a running retention rate gauge comparing your projected and actual attrition.
Cleaning Service Sales Forecast Template Features
- Recurring client roster tracking residential and commercial accounts by service frequency and rate
- Weighted one-time job pipeline: move-out cleans, deep cleans, and project work with probability weights
- Revenue split by type (residential recurring, commercial recurring, one-time) across all 12 months
- Capacity check comparing projected revenue to available cleaner hours by month
- Three-scenario comparison with adjustable attrition, acquisition, and rate increase assumptions
- Actual vs forecast tracker with rolling 12-month client retention rate calculation
How to Use This Cleaning Service Sales Forecast Spreadsheet
Start with the Revenue Drivers sheet. Enter your current active client counts by category — residential biweekly, residential weekly, residential monthly, commercial — along with your average revenue per visit for each. Then set your monthly acquisition and attrition assumptions: how many new clients you expect to add per month and what percentage of your active clients you expect to cancel or pause. If you don't have historical data for attrition, a safe starting estimate for a residential cleaning company is 3-4% per month (roughly one in every 25-30 active clients cancels in any given month). Then open the Recurring Client Roster and enter your actual active clients — this step takes 20-30 minutes for a company with 50-80 recurring clients and is worth doing accurately because it sets your baseline revenue precisely.
Once the foundation is in place, review the Monthly Forecast sheet and check whether the projections make sense against what you know about your business. Pay attention to the months where you typically see more pauses — June and July as residential clients travel — and whether the seasonality index reflects that correctly. Then run the Scenario Comparison: set a downside where attrition runs at 6% per month and new client adds slow down. If that scenario still covers your payroll and overhead, your business is on solid footing. If the downside scenario puts you close to breakeven, that's useful information before you commit to a lease on additional equipment or hire another full-time cleaner.
15 minutes from download to your first revenue forecast
Download the template, enter your active clients and service rates, and see your cleaning company's projected revenue — month by month, service type by service type.
Why Every Cleaning Company Needs a Sales Forecast Template
Cleaning service revenue has a deceptively simple structure — clients pay a fixed rate per visit on a recurring schedule — but forecasting it accurately is harder than it looks. The core challenge is that client counts drift constantly: new clients sign up, existing clients cancel or pause, and the net change each month compounds over time. A cleaning company that adds 8 new clients per month but loses 10 to attrition is slowly shrinking even if each individual transaction looks fine. Most cleaning business owners don't discover this dynamic until they notice revenue stalling despite a full schedule, because they're tracking bookings rather than active client count and monthly recurring revenue. A sales forecast built around explicit acquisition and attrition assumptions surfaces this math before it becomes a problem.
The two metrics that drive forecasting accuracy in a cleaning business are client retention rate and average revenue per client per month. Retention rate — the inverse of attrition — measures how well you're holding your existing client base. A healthy residential cleaning company retains 92-95% of its clients month over month (meaning 3-5% cancel or pause in any given month). When attrition runs higher, the fix is almost never more marketing — it's usually response time, consistency of cleaner assignment, or a service quality issue that clients tolerate for a few months before quietly cancelling. Average revenue per client is the other lever: if you're adding the same number of clients as last year but revenue isn't growing, your rates haven't kept up with your costs. Tracking both metrics monthly rather than watching total revenue alone tells you exactly which lever to pull.
Cleaning Service Industry at a Glance
Financial templates built for residential and commercial cleaning businesses — pre-loaded with labor, supplies, and overhead categories, and structured around the recurring contract model most cleaning companies run on.
Revenue Drivers
- Recurring residential contracts
- Commercial cleaning contracts
- One-time deep cleans
- Move-in/move-out cleaning
- Post-construction cleanup
Key Cost Categories
- Labor (wages & payroll taxes)
- Cleaning supplies & chemicals
- Equipment & tools
- Vehicle & transportation
- Liability insurance
- Marketing & advertising
Typical Margins
Gross: 40-55% · Net: 10-20%
Seasonality
Spring (March-April) peaks with spring cleaning demand; back-to-school surge in August-September; summer slightly slower as clients vacation; commercial cleaning demand is relatively steady year-round.
Key Performance Indicators
Cleaning Service Sales Forecast Template FAQ
More Cleaning Service Templates
Cleaning Service Balance Sheet Template for Excel
$29
Cleaning Service Budget Template for Excel
$29
Cleaning Service Business Plan Template for Excel
$39
Cleaning Service Cash Flow Template for Excel
$29
Cleaning Service Expense Tracker Template for Excel
$29
Cleaning Service Financial Model Template for Excel
$29
Cleaning Service Income Statement Template for Excel
$29
Cleaning Service Invoice Template for Excel
$29
Cleaning Service KPI Dashboard Template for Excel
$29
Cleaning Service P&L Template for Excel
$29
Cleaning Service Pro Forma Template for Excel
$29
Cleaning Service Project Budget Template for Excel
$29
Cleaning Service Business Valuation Template for Excel
$29
More Sales Forecast Templates
Cleaning Service Sales Forecast Template
$29