Church Sales Forecast Template
Project your church's revenue across tithes, offerings, facility rentals, and special campaigns — with a pre-built seasonal giving model and monthly rollup built for ministry finance teams.
What's Inside This Church Revenue Forecast Template
This template includes 5 worksheets, each designed for a specific part of your church financial workflow:
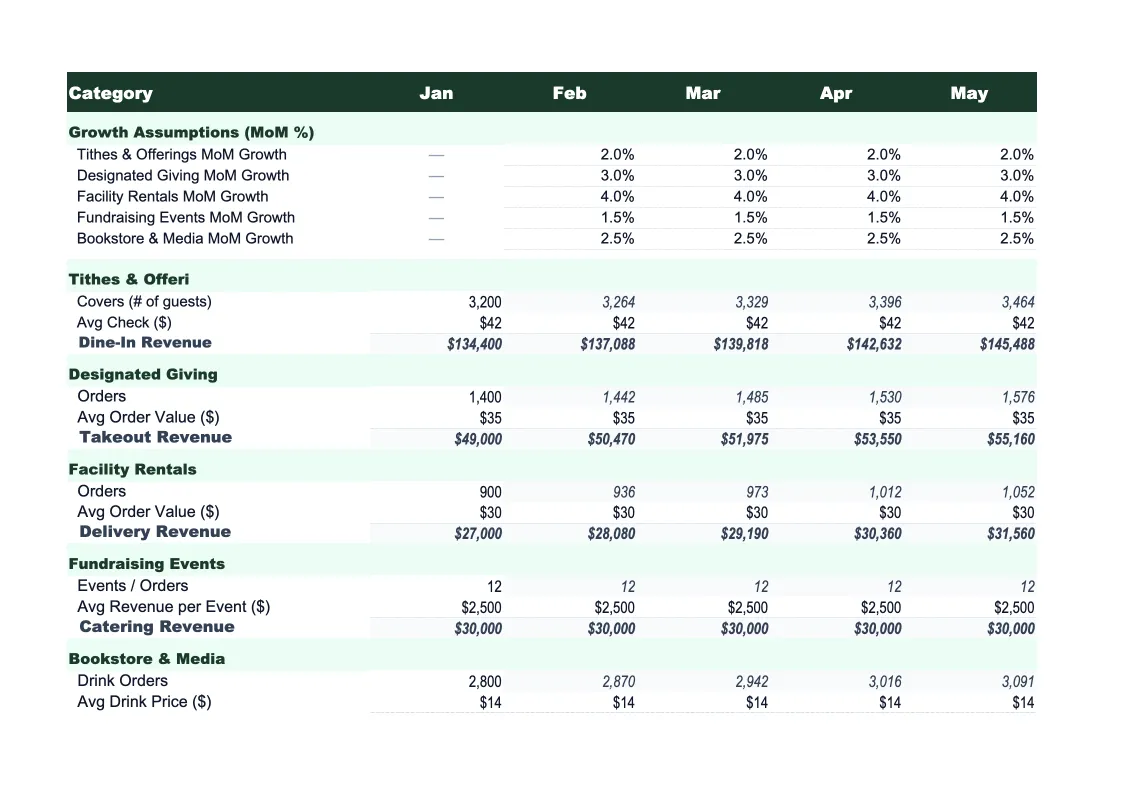
Revenue Forecast
The core planning sheet where you project each revenue stream by month across the full fiscal year.
Giving Trends
A historical giving analysis sheet that pulls in two to three years of actual giving data alongside your current projections.
Campaign Tracker
A pledge campaign tracking sheet for capital campaigns, building funds, mission drives, and special appeals.
Seasonal Model
A seasonality adjustment sheet built around the giving patterns common to most churches: the Christmas and Easter peaks, the summer attendance and giving dip, and the year-end giving surge driven by tax deadlines.
Actual vs Forecast
A monthly variance tracker that compares projected revenue to what actually came in, updated as offerings are recorded and deposits are made.
Church Revenue Forecast Template Features
- Monthly giving projections across tithes, offerings, rentals, tuition, and special campaigns
- Historical giving trends with year-over-year comparison and giving-per-attender calculation
- Pledge campaign tracker with staggered cash receipt projections for multi-year campaigns
- Seasonal model pre-loaded with Christmas, Easter, and summer giving adjustment factors
- Actual vs forecast variance tracker with color-coded alerts by revenue stream
- Fiscal year setup that works with both calendar-year and July–June church fiscal calendars
How to Use This Church Revenue Forecast Spreadsheet
Start with the Giving Trends sheet before you enter a single projection. Pull two to three years of actual giving from your accounting software or giving platform and enter the annual totals by stream. The sheet will calculate your historical growth rate and giving per attender, which gives you an honest baseline for the projections you're about to set. Most churches find that their assumptions become significantly more conservative — and more accurate — once they see the actual trend line rather than working from memory or optimism.
Move to the Revenue Forecast sheet and enter your monthly projections for each income stream. Use the Seasonal Model sheet to apply your church's actual giving pattern — or the default weights if you're in your first year of forecasting — so the monthly distribution reflects when money actually arrives. If you're running a capital campaign, open the Campaign Tracker and enter your pledge data: total pledged, expected fulfillment rate, and the payment schedule. The campaign sheet feeds into the Revenue Forecast automatically so your total projection includes both regular giving and campaign cash.
15 minutes from download to your first giving projection
Download the template, enter your historical giving data, and get a clear monthly picture of your church's revenue outlook — seasonal model, campaign tracker, and variance reporting included.
Why Every Church Needs a Revenue Forecast Template
Church revenue forecasting is more complex than it appears because giving is voluntary, episodic, and tied to attendance patterns that shift by season and life stage. Most churches build their annual budget using last year's giving as a baseline with a modest growth assumption, but that approach misses the real drivers — changes in congregation size, the age profile of your top givers, whether a large pledge campaign is entering its fulfillment year, and the impact of a summer attendance drop that's bigger or smaller than usual. Without a structured forecast, finance teams often don't know they're running behind until October, when there's limited runway to respond.
A complete church revenue forecast tracks income by stream because each stream behaves differently. Regular tithes and weekly offerings are tied to attendance and congregation engagement — they're relatively predictable but sensitive to pastoral transitions, growth campaigns, and community events. Facility rentals and school tuition are contractual and the most predictable income a church has. Special campaigns and one-time appeals are event-driven and need their own tracking because pledge fulfillment rates vary widely: most churches see 75–90% of pledges actually paid over the pledge period, but that range matters when a campaign represents 15% of annual revenue. Modeling each stream separately, with its own assumptions and timing, produces forecasts that finance committees can actually act on.
Church Industry at a Glance
Financial templates built for churches and religious organizations — facility rentals, ceremony fees, staff payroll, and ministry budgets.
Revenue Drivers
- Tithes and weekly offerings
- Facility rental income
- Special offerings (Christmas, Easter)
- School and childcare tuition
- Cemetery and memorial service fees
Key Cost Categories
- Personnel and housing allowance
- Facilities and occupancy
- Worship and ministry programs
- Missions and benevolence
- Administration and software
- Debt service
Typical Margins
Gross: N/A · Net: 0-5% operating surplus
Seasonality
Giving peaks at Christmas and Easter; summer typically sees 10-20% attendance and giving decline. Year-end giving surge in December is common for tax purposes.
Key Performance Indicators
Church Revenue Forecast Template FAQ
More Church Templates
Church Balance Sheet Template for Excel
$29
Church Budget Template for Excel
$29
Church Budget & Financial Plan Template for Excel
$39
Church Cash Flow Template for Excel
$29
Church Expense Tracker Template for Excel
$29
Church Financial Model Template for Excel
$29
Church Income Statement Template for Excel
$29
Church Invoice Template for Excel
$29
Church KPI Dashboard Template for Excel
$29
Church P&L Template for Excel
$29
Church Pro Forma Template for Excel
$29
Church Project Budget Template for Excel
$29
Church Valuation Template for Excel
$29
More Sales Forecast Templates
Church Sales Forecast Template
$29