Stackrows
Healthcare Financial Model Template
A
B
C
D
E
F
G
1
Category
Budget
Actual
2
3
4
5
6
7
8
Assumptions
Patient Volume & Revenue
Payer Mix & Reimbursement
Provider Staffing & RVU Model
Expenses & Overhead
Accounts Receivable
P&L
KPI Dashboard

Healthcare Financial Model Template

Model patient volume by payer, forecast provider revenue based on RVU production, and track accounts receivable — built for private practices, clinics, and medical groups.

$29Save 6+ hours vs. building a healthcare financial model from scratch
Instant download after purchase
Works in Excel & Google Sheets
30-day money-back guarantee
.xlsx280 KB8 sheetsUpdated 2026-03-23

What's Inside This Healthcare Financial Model Template

This template includes 8 worksheets, each designed for a specific part of your healthcare financial workflow:
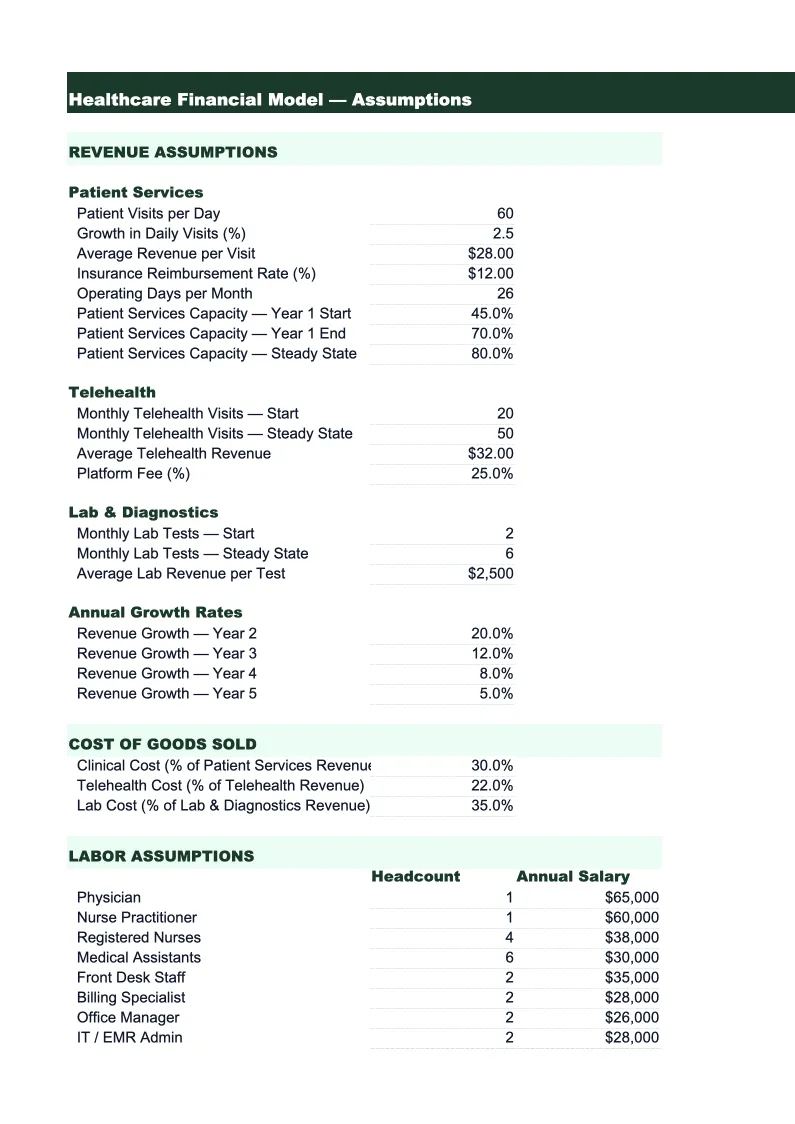
1

Assumptions

The central control sheet where you enter your practice's key operating parameters. Inputs include: number of providers by type (physician, NP, PA), average visits per provider per day, working days per year, fee schedule by payer (Medicare rates, Medicaid rates, commercial payer rates, and self-pay rates), payer mix percentages, average collections per visit, net collection rate by payer, and expected claim denial rate. Also includes inputs for new patient percentage, no-show rate, and visit-type mix (office visits, procedures, annual wellness exams). The overhead structure section captures fixed and variable expenses so the model can calculate your cost per visit. Changing an assumption here flows through every sheet automatically — making it easy to run scenarios: what if you add a nurse practitioner? What if your commercial payer mix grows from 40% to 50%? What does a 5% increase in Medicare rates do to annual revenue?

2

Patient Volume & Revenue

A 24-month patient volume and gross revenue schedule broken down by provider and payer type. Each provider row shows scheduled visits, no-show and cancellation adjustments to arrive at completed visits, and billed charges based on your fee schedule inputs. Revenue is then shown at three levels: billed charges, expected allowed amount (what payers contractually allow), and net collections after adjustments. The payer columns cover Medicare, Medicaid, commercial insurance, and self-pay separately so you can see exactly how changes in payer mix affect collections. Gross charges are typically 2–4x collections in healthcare — this sheet shows both so you understand the gap between what you bill and what you actually collect. Monthly revenue totals feed directly into the P&L and AR sheets.

3

Payer Mix & Reimbursement

A detailed breakdown of revenue by payer and CPT code category. The payer mix section shows each insurance type as a percentage of total visits and total revenue — a practice with 35% Medicare, 15% Medicaid, 40% commercial, and 10% self-pay will have very different revenue per visit than one with 60% commercial. The reimbursement section shows your effective rate per visit by payer type after adjustments and write-offs, and calculates your blended net revenue per visit across all payers. A payer mix sensitivity table shows how your annual revenue changes as commercial percentage shifts by 5-point increments — useful for practices trying to optimize their referral and insurance credentialing strategy. Clean claim rate and denial rate inputs affect the effective reimbursement shown here, connecting billing performance to revenue.

4

Provider Staffing & RVU Model

A productivity and cost model for each clinical provider. The RVU section shows each provider's scheduled visits, visit-type mix (new patient, established visit, procedure), and the wRVU (work relative value unit) value for each visit type, producing total wRVUs per provider per month. Total wRVUs are multiplied by your conversion factor to arrive at productivity-based revenue — the framework used by most physician compensation plans and benchmarked against MGMA median wRVU targets by specialty. Provider cost rows show base salary, benefits (typically 20–30% of salary for a full-time physician), malpractice insurance premium, and continuing education. Provider net contribution — revenue attributable to that provider minus their fully loaded cost — is calculated for each provider. For practices considering adding or replacing a provider, this sheet shows the revenue ramp and break-even timeline based on your credentialing and ramp-up assumptions.

5

Expenses & Overhead

A monthly detail of all practice operating expenses not directly tied to individual providers. Categories cover: clinical staff (nurses, medical assistants, phlebotomists, scribes — shown with headcount, wages, and benefits); administrative and front office staff (front desk, billing specialists, practice administrator); occupancy costs (rent, CAM charges, utilities, janitorial); clinical supplies (exam gloves, syringes, dressings, point-of-care testing supplies); technology and software (EMR/EHR subscription, practice management system, patient portal, telehealth platform, billing software); professional services (billing company fees as a percentage of collections, CPA, legal); malpractice and other insurance; marketing and patient acquisition; and equipment maintenance and lease costs. Total overhead is shown alongside total revenue with overhead as a percentage of revenue — a well-run primary care practice typically runs 55–70% overhead as a percentage of collections, while specialty practices can be lower due to higher procedure revenue.

6

Accounts Receivable

A monthly AR aging and cash collections model — one of the most important sheets for any healthcare practice. The model tracks gross AR by payer, expected collections by aging bucket (current, 30 days, 60 days, 90 days, 120+ days), and the percentage of claims that are denied, resubmitted, or written off at each stage. Days in AR is calculated automatically each month — the primary metric used to benchmark billing department performance, with industry standard under 35 days for well-run practices, and over 50 days signaling collection problems. Net collections rate (actual cash received divided by net charges) is tracked monthly alongside the industry benchmark of 95–98% for commercial payers. The cash collections column shows actual expected cash receipts each month after accounting for AR timing, which feeds directly into the cash flow sheet — this is what separates a healthcare model from a simple revenue projection, since collections often lag billing by 30–60 days.

7

P&L

A 24-month income statement built from the revenue, staffing, and overhead sheets. Net patient service revenue is shown at the top after contractual adjustments and bad debt — the correct starting point for a healthcare P&L under both GAAP and healthcare industry convention, not gross billed charges. Clinical staff costs are separated from administrative costs below revenue to show the cost of delivering care versus the cost of running the practice. The model calculates gross margin (net revenue minus direct clinical staff and supply costs), operating income (after overhead), and net income after any financing costs. Key ratios calculated automatically for each month: overhead as a percentage of net revenue, provider compensation as a percentage of net revenue, and net margin. MGMA benchmarks for primary care and specialty practices are noted in the margin lines so you can compare your projected performance to industry medians — useful both for internal planning and for showing a lender or investor that your projections are grounded in industry reality.

8

KPI Dashboard

A one-page visual summary of the operational and financial metrics that practice managers, medical directors, and healthcare lenders review most closely. Charts included: monthly net collections trend, days in AR over time, payer mix as a percentage of revenue, and provider productivity (wRVUs per provider per month). Key metrics displayed at the top: current month net collections, net collection rate, days in AR, total wRVUs month-to-date, revenue per visit, and overhead rate. A provider productivity table shows each provider's visits, wRVUs, and collections versus MGMA median benchmarks for their specialty. All metrics pull automatically from the underlying sheets — no additional data entry is needed once the model is populated. This dashboard is designed to be printed or exported as a PDF for monthly management meetings, board reviews, or lender covenant reporting.

Healthcare Financial Model Template Features

  • Payer mix model separating Medicare, Medicaid, commercial insurance, and self-pay revenue with reimbursement rates by payer
  • Provider productivity tracking using wRVU methodology with MGMA benchmark comparisons by specialty type
  • Accounts receivable aging model with days-in-AR and net collection rate calculations by payer and aging bucket
  • 24-month patient volume and revenue schedule with no-show rate, visit-type mix, and fee schedule inputs
  • Provider-level contribution model showing net revenue per provider versus fully loaded provider cost including malpractice and benefits
  • KPI dashboard with days in AR, net collection rate, overhead percentage, and wRVU productivity trends

How to Use This Healthcare Financial Model Spreadsheet

Start with the Assumptions sheet. Enter your provider roster, average visits per day per provider, and your payer mix percentages based on last year's actual claims data — your billing system or clearinghouse can pull this by payer in about 10 minutes. If you don't have exact figures, use your Medicare Explanation of Benefits and commercial remittances to estimate reimbursement per visit by payer type. Enter your net collection rate by payer — if you're unsure, 95–97% is a reasonable starting point for commercial payers, 90–93% for Medicare, and 70–80% for Medicaid depending on your state. Set your no-show and cancellation rate from your scheduling data. These inputs are the foundation that drives every revenue figure downstream.

With the assumptions in place, move to the Provider Staffing & RVU Model sheet and enter each provider's visit schedule and visit-type mix. Review the wRVU targets against the MGMA benchmarks shown — if a provider is projected to produce significantly fewer wRVUs than the median for their specialty, that's worth understanding before you finalize the model. Then work through the Expenses & Overhead sheet using last year's actual expenses as your baseline, adjusting for any planned changes: a new hire, a lease renewal, a transition to a new EMR. The AR sheet will model your collections timing automatically once revenue is set up. Your first complete model review should take 60–90 minutes total.

Use the model as a forward-looking management tool throughout the year. After each month closes, enter actual collections, visits, and expenses in the corresponding columns — the AR aging and days-in-AR calculations will show you whether your billing department is keeping pace. Review the KPI Dashboard at monthly leadership meetings: if days in AR is creeping up, that's a billing workflow or denial management issue that needs attention before it compounds. If a provider's wRVU production is below their projected target, it may signal a scheduling problem, a panel capacity issue, or an EMR documentation backlog. The dashboard puts those signals in one place so you can act on them early rather than discovering problems at year end.

15 minutes from download to your first revenue projection

Download the template, enter your provider roster and payer mix, and see your practice's full financial picture — collections, AR aging, provider productivity, and overhead all in one place.

Why Every Medical Practice Needs a Financial Model

Medical practice finances are more complex than most small businesses because revenue is determined by three separate variables — visit volume, payer mix, and reimbursement rates — that all move independently of each other. A practice can increase visits by 10% and see revenue decline if the new patients skew toward Medicaid, which reimburses at 40–60% of commercial rates. It can hold volume steady and see revenue drop if a major commercial payer renegotiates rates at renewal. Without a model that separates these variables, a practice administrator can't tell whether a revenue shortfall came from fewer patients, a worse payer mix, declining collections performance, or a reimbursement rate change — and each of those causes requires a completely different response.

The financial metrics that define a healthy medical practice are distinct from other service businesses. Days in accounts receivable — how long it takes to collect a dollar of billed charges — should be under 35 days for a well-run practice; above 50 days typically signals billing workflow problems, excessive claim denials, or understaffed collections. Net collection rate, the percentage of net charges actually collected, should be 95–98% for commercial payers; below 92% means money is being written off that shouldn't be. Provider productivity measured in wRVUs per year provides a specialty-specific benchmark that eliminates the distortion of payer mix — a physician producing 5,200 wRVUs annually is performing similarly whether they're in a commercial-heavy suburban practice or a Medicaid-heavy safety-net clinic. These are the numbers that practice consultants, healthcare lenders, and DSO acquisition teams use to evaluate financial health.

For practices seeking a bank line of credit, SBA financing, or a private equity or DSO partnership, a healthcare-specific financial model is the first document that separates a serious practice from one that hasn't thought through its numbers. Healthcare lenders specifically want to see payer mix risk — what percentage of revenue would disappear if a single commercial payer contract was terminated? PE buyers and DSOs focus heavily on EBITDA margin (typically 10–20% for well-run specialty practices) and the relationship between provider compensation as a percentage of collections and the industry benchmarks. This model produces all of those outputs in a format that healthcare financial professionals recognize, and it makes the assumptions behind your projections explicit and auditable.

Healthcare Industry at a Glance

Financial templates built for healthcare practices — from private clinics and therapy offices to specialty practices and medical groups. Pre-loaded with billing categories, insurance reimbursement tracking, and healthcare-specific KPIs.

Revenue Drivers

  • Insurance reimbursements
  • Patient copays and coinsurance
  • Out-of-pocket self-pay
  • Capitation payments

Key Cost Categories

  • Clinical staff salaries
  • Administrative and billing staff
  • Medical supplies
  • Malpractice insurance
  • EMR/EHR software
  • Facility rent and occupancy

Typical Margins

Gross: 45-65% · Net: 10-25%

Seasonality

Higher patient volume in fall/winter flu season; slower in summer. End-of-year spike as patients meet deductibles.

Key Performance Indicators

Days in accounts receivableNet collection rateClaim denial rateClean claim rateAR aging over 90 days

Healthcare Financial Model Template FAQ

Healthcare Financial Model Template

$29