Manufacturing P&L Template
Track your manufacturing operation's revenue, material costs, direct labor, overhead, and net income with a P&L template built for producers — not a generic spreadsheet you have to rebuild from scratch.
What's Inside This Manufacturing P&L Template
This template includes 4 worksheets, each designed for a specific part of your manufacturing financial workflow:
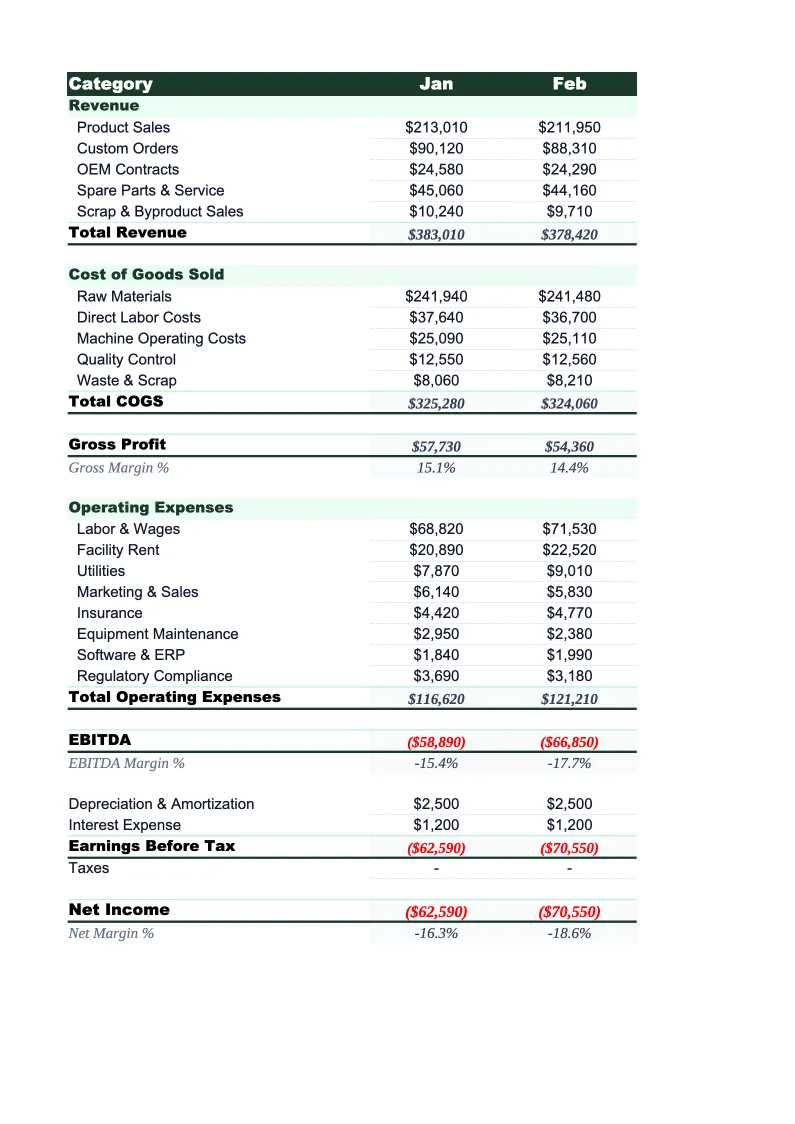
Monthly P&L
The core worksheet where you record each month's revenue and costs.
Annual P&L
A 12-month rollup that pulls from the Monthly P&L sheet automatically.
Cost of Goods Analysis
A dedicated worksheet for breaking down and analyzing your cost of goods sold in detail.
Dashboard
A one-page visual summary with pre-built charts and key financial metrics.
Manufacturing P&L Template Features
- Revenue split by product line or customer segment
- COGS broken into materials, direct labor, and manufacturing overhead
- Gross margin and net income auto-calculated each month
- Cost of goods analysis with material and labor cost percentages
- Standard cost vs. actual cost variance tracking
- 12-month annual P&L with full-year totals and visual dashboard
How to Use This Manufacturing P&L Spreadsheet
Download the .xlsx file and open it in Excel or Google Sheets — no macros, no add-ins, no setup beyond entering your numbers. Start with the Monthly P&L sheet. Review the pre-loaded revenue and cost categories and adjust them to match your operation: rename product lines to match your SKUs or customer segments, update material categories to reflect what you actually buy, and remove any line items that don't apply. Most manufacturers find the structure requires only minor adjustments and can complete the initial setup in 15–20 minutes.
Enter your monthly revenue and costs directly from your accounting system or production reports. For the Cost of Goods Analysis sheet, pull material purchase data by category, direct labor hours from your time-tracking or payroll system, and allocated overhead from your cost accounting records. The sheet will calculate your material cost percentage, labor cost percentage, and overhead absorption rate automatically. If you track standard costs, enter your targets in the designated column and the variance column will highlight where actuals are running above or below plan.
15 minutes from download to your first P&L
Download the template, enter last month's production costs and revenue, and see your manufacturing operation's gross margin and net income — with material and labor percentages calculated automatically.
Why Every Manufacturer Needs a P&L Template
Manufacturing profit and loss statements are more complex than most other industries because the path from revenue to gross profit runs through three distinct cost layers: raw materials, direct labor, and manufacturing overhead. Each one behaves differently. Material costs fluctuate with commodity prices and supplier relationships. Direct labor scales with production volume and efficiency. Overhead — equipment depreciation, utilities, facility costs, indirect labor — is largely fixed and only gets more manageable as volume grows. Without a P&L that separates these correctly, it's nearly impossible to know whether a margin problem is a purchasing issue, an efficiency issue, or an overhead absorption issue.
A well-structured manufacturing P&L shows gross margin as the first profitability metric — revenue minus COGS, before SG&A and other period costs. For most manufacturers, gross margins run between 20% and 35%, depending on the segment. Job shops and contract manufacturers tend toward the lower end because material and labor are the dominant costs and pricing pressure is high. Branded manufacturers and those with proprietary products or processes often achieve higher margins. Below gross profit, SG&A, sales commissions, and R&D are tracked separately so you can see how much of your gross profit is being consumed by the cost of running the business versus making the product.
Manufacturing Industry at a Glance
Financial templates built for manufacturers — from job shops and contract fabricators to production facilities. Pre-loaded with cost categories, billing structures, and KPIs specific to how manufacturers track materials, labor, and overhead.
Revenue Drivers
- Product sales
- Contract/job shop work
- Tooling and setup fees
- NRE charges
- Material markups
- Aftermarket parts and service
Key Cost Categories
- Raw materials / direct materials
- Direct labor
- Manufacturing overhead
- Outside processing / subcontracting
- Equipment depreciation
- SG&A
Typical Margins
Gross: 20-35% · Net: 4-10%
Seasonality
Q1 weakest across most segments. Q3/Q4 strongest for consumer goods and construction materials manufacturers. Automotive suppliers follow OEM model-year shutdowns. Industrial equipment sees Q4 budget-spend surge.
Key Performance Indicators
Manufacturing P&L Template FAQ
More Manufacturing Templates
Manufacturing Balance Sheet Template for Excel
$29
Manufacturing Budget Template for Excel
$29
Manufacturing Business Plan Template for Excel
$39
Manufacturing Cash Flow Template for Excel
$29
Manufacturing Expense Tracker Template for Excel
$29
Manufacturing Financial Model Template for Excel
$29
Manufacturing Income Statement Template for Excel
$29
Manufacturing Invoice Template for Excel
$29
Manufacturing KPI Dashboard Template for Excel
$29
Manufacturing Pro Forma Template for Excel
$29
Manufacturing Project Budget Template for Excel
$29
Manufacturing Sales Forecast Template for Excel
$29
Manufacturing Business Valuation Template for Excel
$29
Manufacturing P&L Template
$29