Manufacturing Financial Model Template
Model production revenue by product line or job type, track materials and direct labor costs against standard costs, and project cash flow through your production and payment cycles — built for job shops, contract fabricators, and production manufacturers.
What's Inside This Manufacturing Financial Model Template
This template includes 7 worksheets, each designed for a specific part of your manufacturing financial workflow:
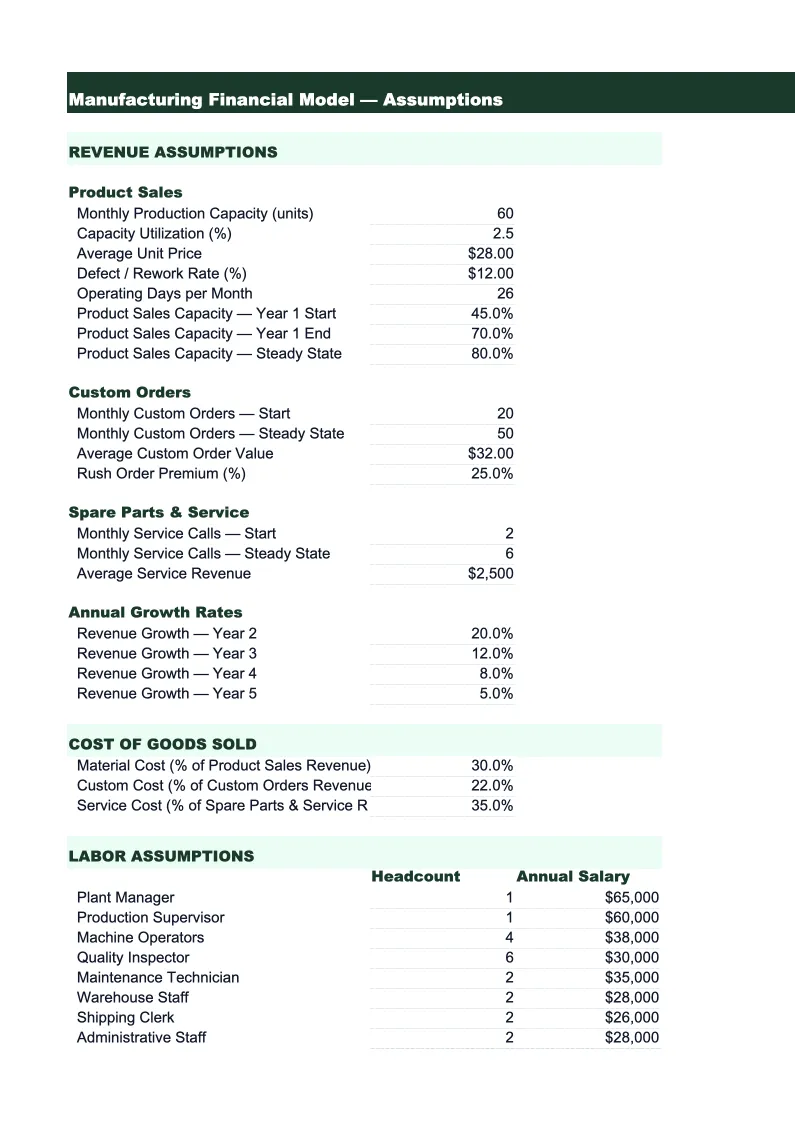
Assumptions
The control panel for the entire model.
Revenue Projections
A 24-month revenue forecast built around your production capacity and utilization rate.
Cost of Goods Sold
A detailed cost model that breaks COGS into the three components every manufacturer tracks: direct materials, direct labor, and manufacturing overhead.
Workforce Plan
A monthly headcount and labor cost model organized by department: production workers (split by shift or line if needed), setup and tooling technicians, quality control, production supervision, shipping and receiving, and SG&A functions.
P&L
A 24-month profit and loss statement that pulls revenue from the Revenue Projections sheet and costs from the COGS and Workforce Plan sheets.
Cash Flow
A monthly cash flow statement that captures the working capital dynamics specific to manufacturing.
Dashboard
A one-page visual summary of the model's key outputs designed for owner reviews, lender meetings, or investor conversations.
Manufacturing Financial Model Template Features
- Capacity utilization revenue model with up to six product lines or job categories tracked separately
- Three-component COGS model: direct materials, direct labor, and manufacturing overhead with standard cost variance tracking
- Working capital cash flow model showing AR timing, AP timing, and inventory investment by production phase
- Workforce plan with overtime modeling that activates when utilization exceeds your capacity threshold
- 24-month P&L with EBITDA, operating margin, and standard cost variance line
- Two-scenario toggle on the Dashboard to compare base case versus growth or downside projections
How to Use This Manufacturing Financial Model Spreadsheet
Start with the Assumptions sheet. Enter your monthly production capacity (units or machine hours), your current or target utilization rate, and your average selling price by product line. Then set your standard costs: material cost per unit, direct labor hours per unit and labor rate, and your overhead rate. If you run a job shop, enter the split of your revenue across job types — prototype work, production runs, tooling — since each has a different margin profile. For an existing manufacturer, pull these numbers from last year's income statement and job costing reports; for a startup, use industry benchmarks as a starting point and update them as you have real data. The full setup takes 30–45 minutes.
Once assumptions are in, review the Revenue Projections and COGS sheets. Check that monthly gross margin looks right — for most contract manufacturers, blended gross margin should fall in the 20–35% range; if it's significantly outside that, review your material cost and labor rate inputs. Then look at the Cash Flow sheet carefully: the section that shows working capital requirements is where most manufacturers are surprised. When you increase production volume or win a large new contract, you'll see the cash drain from purchasing materials and paying labor weeks before the customer pays their invoice. That timing gap — your cash conversion cycle — is the number your bank and any investors will focus on. Knowing it in advance lets you plan for a line of credit or time your growth more carefully.
15 minutes from download to your first manufacturing projection
Download the template, enter your capacity, utilization, and standard costs, and see your factory's full financial picture — production margins, working capital cycle, and cash position through 24 months.
Why Every Manufacturer Needs a Financial Model
Manufacturing is a capital-intensive business where margins are thin and timing is everything. Gross margins of 20–35% look reasonable until you account for the working capital required to fund production: you buy materials weeks before you build the product, you build the product weeks before you ship it, and you ship it weeks before the customer pays. A business doing $500,000 per month in revenue might have $200,000 or more tied up in that production cycle at any given time. Without a model that shows that cash flow explicitly, manufacturers routinely run out of cash while growing — profitable on paper, illiquid in the bank account.
The metrics that drive manufacturing financial health fall into three categories. Margin metrics: gross margin (targeting 20–35% for contract work, 35–55% for proprietary products), standard cost variance (the difference between your budgeted and actual cost per unit, which tells you whether your cost structure is under control), and EBITDA margin (typically 8–15% for healthy manufacturers). Efficiency metrics: capacity utilization (under 70% means you're underusing fixed assets; over 90% means you're capacity-constrained and should be planning an expansion), revenue per employee (a productivity benchmark that varies widely by automation level and product type), and OEE if you track machine availability. Working capital metrics: inventory days, AR days, and AP days, which together determine how much cash your production cycle consumes. A financial model that surfaces all three categories in one view is what separates a well-run manufacturing operation from one that's flying blind.
Manufacturing Industry at a Glance
Financial templates built for manufacturers — from job shops and contract fabricators to production facilities. Pre-loaded with cost categories, billing structures, and KPIs specific to how manufacturers track materials, labor, and overhead.
Revenue Drivers
- Product sales
- Contract/job shop work
- Tooling and setup fees
- NRE charges
- Material markups
- Aftermarket parts and service
Key Cost Categories
- Raw materials / direct materials
- Direct labor
- Manufacturing overhead
- Outside processing / subcontracting
- Equipment depreciation
- SG&A
Typical Margins
Gross: 20-35% · Net: 4-10%
Seasonality
Q1 weakest across most segments. Q3/Q4 strongest for consumer goods and construction materials manufacturers. Automotive suppliers follow OEM model-year shutdowns. Industrial equipment sees Q4 budget-spend surge.
Key Performance Indicators
Manufacturing Financial Model Template FAQ
More Manufacturing Templates
Manufacturing Balance Sheet Template for Excel
$29
Manufacturing Budget Template for Excel
$29
Manufacturing Business Plan Template for Excel
$39
Manufacturing Cash Flow Template for Excel
$29
Manufacturing Expense Tracker Template for Excel
$29
Manufacturing Income Statement Template for Excel
$29
Manufacturing Invoice Template for Excel
$29
Manufacturing KPI Dashboard Template for Excel
$29
Manufacturing P&L Template for Excel
$29
Manufacturing Pro Forma Template for Excel
$29
Manufacturing Project Budget Template for Excel
$29
Manufacturing Sales Forecast Template for Excel
$29
Manufacturing Business Valuation Template for Excel
$29
More Financial Model Templates
Manufacturing Financial Model Template
$29