Real Estate Pro Forma Example: What to Include and How to Read One
A practical real estate pro forma example — covering NOI, cap rate, cash-on-cash return, IRR, and a worked acquisition model for an income-producing property.
A real estate pro forma is an acquisition underwriting model — the financial analysis you build before buying an income-producing property. It answers one question: given the projected income, expenses, financing, and hold period, does this investment generate the returns your strategy requires?
Every serious real estate investor builds one before submitting an offer. Lenders require one before approving a commercial loan. And the difference between investors who consistently make money and those who don't often comes down to how well they build and stress-test this model.
This post covers what a real estate pro forma includes, the benchmarks that inform the inputs, and a worked acquisition example for a 10-unit multifamily property.
The Most Important Thing About the Seller's Pro Forma
Brokers and sellers routinely provide their own "pro forma" as part of the marketing package. These documents are almost always optimistic. Sellers project pro forma rents — what rents could be after renovations or lease-up — not what tenants are currently paying. Vacancy assumptions are often 2–3% when the market runs 8–10%. Expenses like property management fees, capital expenditure reserves, and realistic insurance costs are frequently omitted.
Before you build your own model, request three documents from the seller:
- T-12 operating statement — trailing 12 months of actual income and expenses
- Current rent roll — who is in the building, what they pay, and when their leases expire
- Tax returns or third-party accounting statements — to cross-reference the T-12
Build your pro forma from the T-12 actuals, not the seller's projections. If your model produces a weaker return than the seller's pro forma suggests, that's the real number.
What a Real Estate Pro Forma Includes
The standard income-property pro forma follows a waterfall: gross potential income works down to net operating income, then to cash flow after debt service.
Potential Gross Income (PGI)
PGI is 100% occupancy at market rents — the theoretical maximum. For a 10-unit multifamily building with an average rent of $1,500/month, PGI is $180,000/year. It's the ceiling, not the expectation.
Vacancy and Credit Loss
Vacancy reduces PGI to reflect units that are genuinely unoccupied. Credit loss captures rent that goes uncollected even when a unit is technically occupied.
According to CBRE's Q3 2025 data, national multifamily vacancy averaged approximately 8.4%. Industrial ran around 7.1%. Retail vacancy held near historically tight levels at 4.1–4.3%. Office vacancy remained elevated at roughly 18.8%.
Use your specific market's vacancy rate, not national averages. A building in a tight urban market may genuinely run 3–4% vacancy; a suburban market with new supply might run 10–12%.
Other Income
Income beyond base rent: parking fees, storage, laundry revenue, signage income, utility reimbursements. In NNN commercial leases, tenants pay most operating expenses — that structure shows up as expense reimbursements in the income section.
Effective Gross Income (EGI)
EGI = PGI − Vacancy − Credit Loss + Other Income
This is the income the property actually produces. NOI is calculated from EGI, not PGI.
Operating Expenses
| Expense Category | Typical Range |
|---|---|
| Property management | 4–10% of EGI |
| Property taxes | 1–4% of assessed value (varies widely by state) |
| Insurance | 0.5–1.5% of property value |
| Repairs and maintenance | $800–$1,500/unit/year (multifamily) |
| Utilities (landlord-paid) | Varies by lease structure |
| Landscaping / janitorial | $500–$1,000/unit/year |
| Administrative / accounting | $200–$400/unit/year |
| Marketing / leasing costs | Variable |
Two expense lines that often get omitted: property management fees (even self-managing investors should model 8–10% — the investment must pencil with professional management to be viable long-term) and capital expenditure reserves (a common rule of thumb is $250–$500/unit/year for multifamily; commercial properties typically reserve 10–15% of NOI for roof, HVAC, parking, and major systems). The real estate income statement example shows how these line items affect OER and NOI benchmarks in practice.
Operating expense ratio (OER) benchmarks by property type:
- Multifamily: 35–50%
- Office: 35–55%
- Retail (gross lease): 60–80%
Net Operating Income (NOI)
NOI = EGI − Operating Expenses
NOI is the most fundamental metric in commercial real estate. It's capital-structure neutral — it ignores financing — which makes it useful for comparing properties regardless of how they're bought. A property worth $2M at a 5% cap rate has NOI of $100,000.
NOI does not include debt service, capital expenditures, depreciation, or income taxes. Most real estate is held through pass-through entities (LLCs, limited partnerships) that avoid corporate-level taxation, so taxes are excluded from the operating pro forma.
Debt Service
Annual mortgage payments (principal + interest). Subtract from NOI to get cash flow before tax.
Key Metrics Calculated in the Pro Forma
Cap Rate
Cap Rate = NOI ÷ Current Market Value
The cap rate translates NOI into a property value — or evaluates whether you're paying a fair price. A $100,000 NOI property valued at a 5.5% cap rate is worth approximately $1.82M. Buying below market cap rates means you're paying more per dollar of income; buying above market cap rates means more yield, typically with more risk.
Per CBRE's H2 2025 Cap Rate Survey:
- Class A multifamily: ~4.74% (gateway markets)
- Class B multifamily: ~4.92%
- Industrial (primary markets): 4.50–5.75%
- Retail: 5.00–6.50%
- Office: 5.25–8.50%+ (varies significantly by quality and occupancy)
Cash-on-Cash Return
CoC = Annual Pre-Tax Cash Flow ÷ Total Equity Invested
CoC measures how efficiently your actual cash equity generates annual distributions. An 8–12% cash-on-cash return is generally considered solid for stabilized income property. It ignores appreciation and equity paydown — useful for comparing income streams but incomplete as a stand-alone metric.
Debt Service Coverage Ratio (DSCR)
DSCR = NOI ÷ Annual Debt Service
Lenders require a minimum DSCR of 1.25x for most commercial real estate loans. A DSCR below 1.0x means the property doesn't generate enough income to cover its loan payments. A DSCR of 1.0x means no margin for error. Most experienced buyers target 1.25x or higher before acquiring a property.
IRR and Equity Multiple
IRR accounts for the timing of all cash flows over the hold period — annual distributions plus net proceeds from the eventual sale. It's the most complete single measure of investment performance.
Typical IRR targets by strategy:
- Core / core-plus (stabilized, low risk): 8–12%
- Value-add (repositioning or lease-up needed): 13–18%
- Opportunistic / development: 18–25%+
The equity multiple shows total return without accounting for time:
- Core: 1.3x–1.6x (7–10 year hold)
- Value-add: 1.7x–2.0x+ (4–7 year hold)
- Opportunistic: 2.0x–3.0x+ (3–5 year hold)
A 2.0x equity multiple over 10 years is far less impressive than 2.0x over 3 years — that's why IRR matters alongside the multiple. Use the real estate cash flow calculator to model how different financing structures change your levered returns.
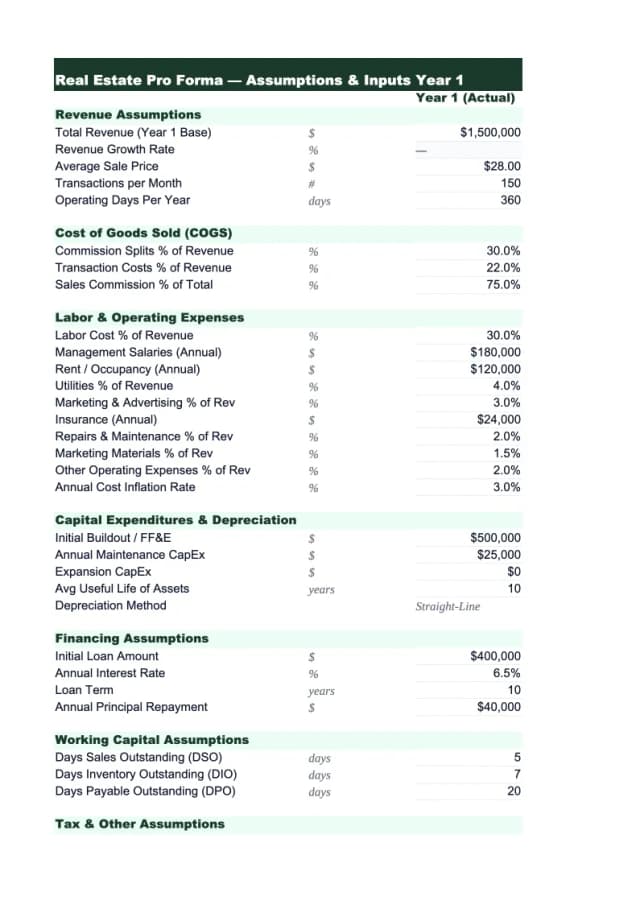
Need a ready-made pro forma template for your real estate?
Download a pre-built spreadsheet with industry-specific categories, formulas, and formatting.
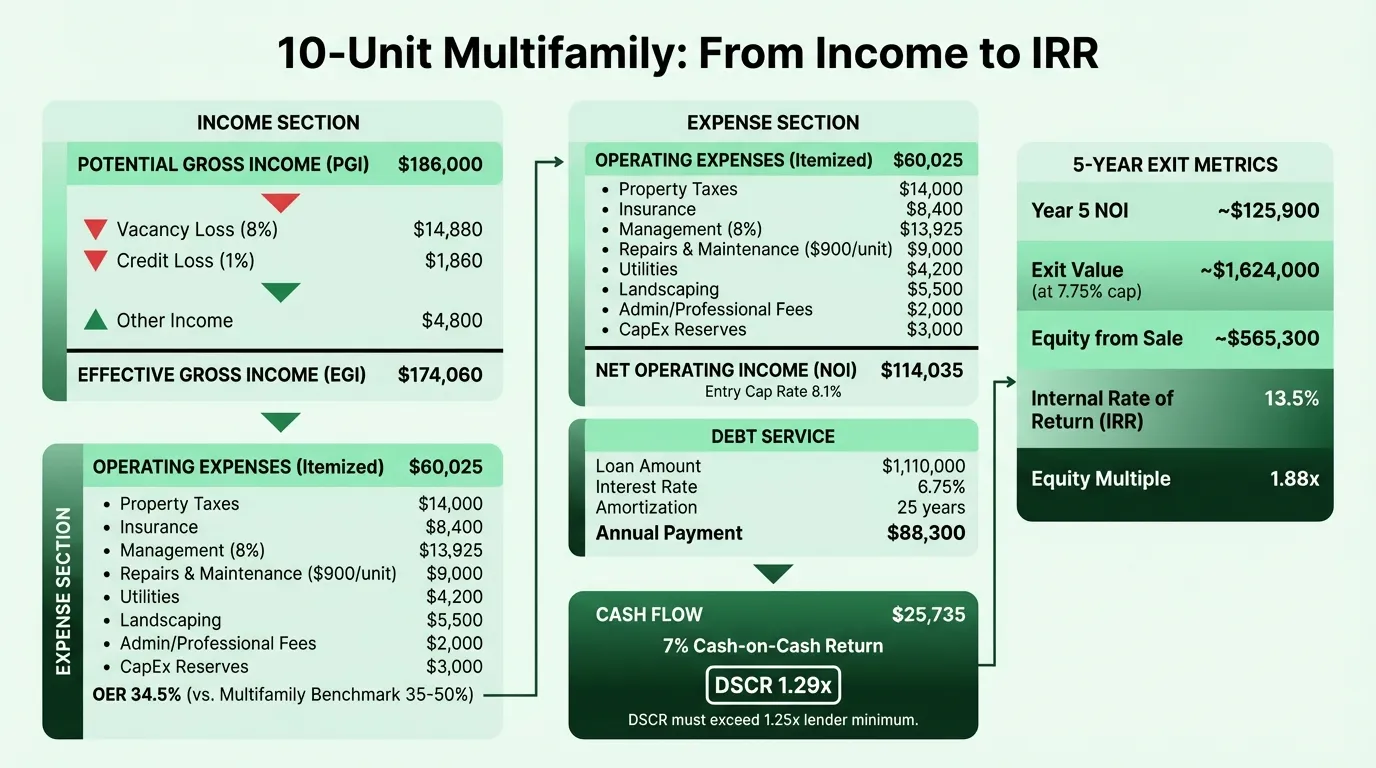
Worked Example: 10-Unit Multifamily Acquisition
This example is a 10-unit apartment building in a secondary market.
Acquisition Assumptions
- Purchase price: $1,400,000
- Closing costs (2%): $28,000
- Immediate capital improvements: $50,000
- Total Acquisition Cost: $1,478,000
- Loan: 75% LTV at 6.75% fixed, 25-year amortization
- Equity invested: $369,500
Year 1 Income Model
| Line Item | Amount |
|---|---|
| Potential Gross Income (10 units × $1,550/mo) | $186,000 |
| Vacancy (8%) | ($14,880) |
| Credit loss (1%) | ($1,860) |
| Other income (parking, laundry) | $4,800 |
| Effective Gross Income | $174,060 |
Year 1 Operating Expenses
| Expense | Amount |
|---|---|
| Property taxes | $14,000 |
| Insurance | $8,400 |
| Property management (8% of EGI) | $13,925 |
| Repairs and maintenance ($900/unit) | $9,000 |
| Utilities (common areas) | $4,200 |
| Landscaping / janitorial | $5,500 |
| Administrative | $2,000 |
| CapEx reserve ($300/unit) | $3,000 |
| Total Operating Expenses | $60,025 |
| OER (Operating Expense Ratio) | 34.5% |
Returns Summary
| Metric | Value |
|---|---|
| Net Operating Income | $114,035 |
| Cap Rate at Purchase Price | 8.1% |
| Annual debt service ($1,110,000 loan) | ($88,300) |
| Annual Cash Flow Before Tax | $25,735 |
| Cash-on-Cash Return | 7.0% |
| DSCR | 1.29x |
At a 5-year exit, assuming 2.5% annual rent growth and an exit cap rate of 7.75% (modest cap rate compression):
| Exit Metric | Value |
|---|---|
| Year 5 NOI (estimated) | ~$125,900 |
| Exit value at 7.75% cap | ~$1,624,000 |
| Selling costs (3%) | ($48,700) |
| Net sale proceeds | $1,575,300 |
| Remaining loan balance | ~($1,010,000) |
| Equity from sale | ~$565,300 |
| Total distributions (5 years) | ~$128,675 |
| Total return to equity | ~$693,975 |
| Equity multiple | ~1.88x |
| IRR (5-year hold) | ~13.5% |
This deal lands in the value-add IRR range (13–18%) — appropriate for a secondary-market building requiring initial improvements. The DSCR of 1.29x clears the standard lender minimum of 1.25x.
The Three Inputs That Move the Model Most
1. Vacancy assumption. A 5% vacancy vs. 10% difference on a $200,000 PGI property is $10,000/year in NOI. At a 7% cap rate, that's $143,000 in property value. Use your actual market's vacancy data, not what you wish the vacancy were.
2. Exit cap rate. The sale price depends entirely on what cap rate the market values the property at when you sell. Projecting cap rate compression (buying at 8%, selling at 6.5%) makes returns look good on paper. Conservative underwriting assumes exit at a flat or slightly higher cap rate than acquisition — don't model your way to a good deal.
3. Operating expenses. Insurance and property taxes have risen significantly since 2022. Use current, market-specific expense data rather than stale OER benchmarks. When building your own model, start with the T-12 actuals and adjust, don't start with national averages. The real estate balance sheet example shows how acquisition costs flow onto the asset schedule, which directly affects your depreciation and tax basis going forward.
How the Pro Forma Fits the Broader Picture
A real estate pro forma is an acquisition model — it covers the underwriting decision. Once you own the property, ongoing financial tracking shifts to the income statement and balance sheet.
The Real Estate Pro Forma Template is built for income-property acquisition underwriting: a 10-year projection model with PGI-to-NOI waterfall, debt service calculation, and IRR/equity multiple output. For historical financial reporting, the Real Estate Financial Model Template covers the ongoing performance tracking side.
For a construction or ground-up development project, the pro forma structure differs substantially — covering hard costs, soft costs, contingency, and development returns rather than stabilized income analysis. That's covered separately in the construction pro forma example.
A real estate pro forma built from T-12 actuals, realistic vacancy assumptions, and conservative exit underwriting won't always show you a great deal — but it will accurately show you which deals aren't great before you close on them. Present your pro forma to stakeholders with Deckary.
Last updated: March 24, 2026
Frequently Asked Questions
Related Articles
Coffee Shop Income Statement Example: Revenue, Costs, and Margins
A coffee shop income statement example with beverage cost benchmarks, labor targets, prime cost rules, and a worked P&L for an independent café doing $480K/year.
Daycare Income Statement Example: Revenue, Costs, and Margins
A daycare income statement example with tuition revenue, CACFP reimbursements, staff cost benchmarks, and a worked P&L for a 50-child childcare center.
Food Truck Income Statement Example: Line Items and Benchmarks
A food truck income statement example with food cost benchmarks, unique line items like commissary and pitch fees, and a worked P&L for a single-truck operation.
Healthcare Income Statement Example: Revenue, Expenses, and Margins
A healthcare income statement example covering net patient revenue, contractual adjustments, expense benchmarks, and operating margin targets for providers.
Healthcare Pro Forma Example: What to Include and How to Build One
A practical healthcare pro forma example — covering revenue projections, payer mix, expense benchmarks, and a worked model for a new medical practice or service line.
Hotel Pro Forma Example: What to Include and How to Build One
A practical hotel pro forma example — covering RevPAR, GOP, undistributed expenses, FF&E reserves, and a worked model for acquisition or development underwriting.