Real Estate Cash Flow Template
Track commission timing, management fee income, and monthly expenses with a cash flow template built for real estate agents, brokers, and property managers.
What's Inside This Real Estate Cash Flow Template
This template includes 5 worksheets, each designed for a specific part of your real estate financial workflow:
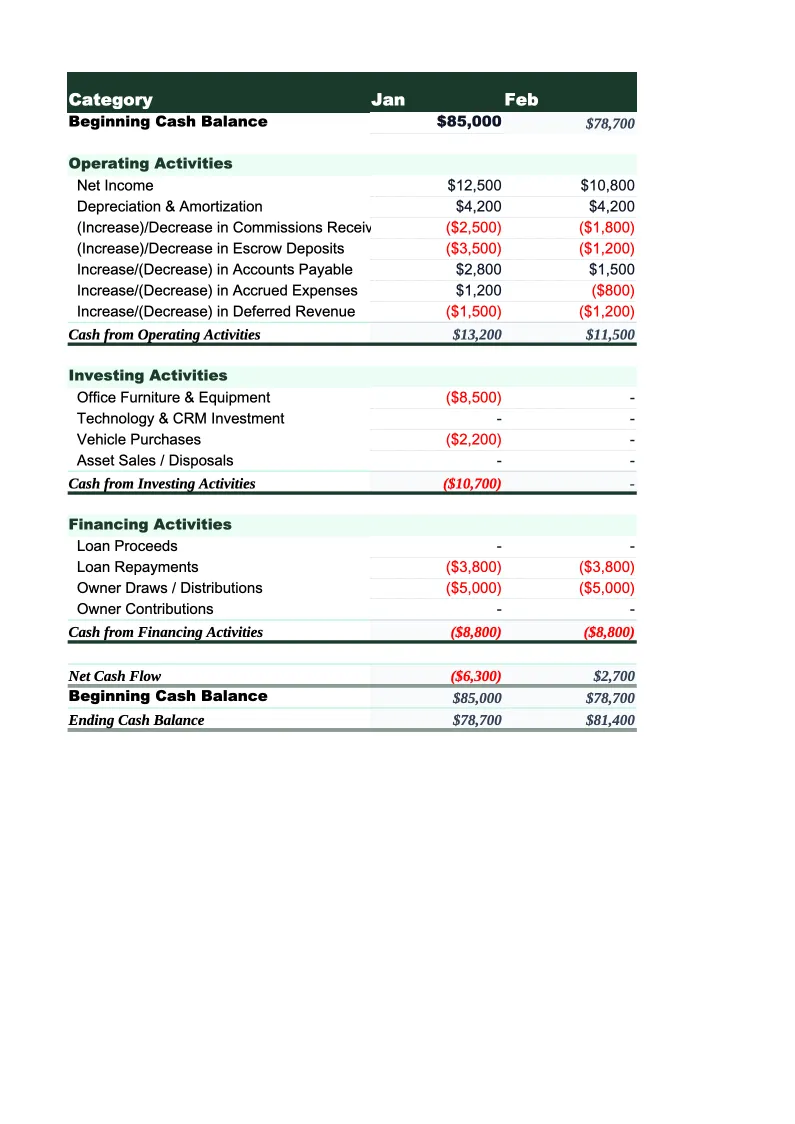
Monthly Cash Flow
A month-by-month view of every dollar moving in and out of a real estate practice.
Commission Pipeline
A forward-looking tracker for deals under contract and their expected close dates.
Annual Cash Flow
A 12-month summary that pulls from the Monthly Cash Flow sheet and organizes the year into quarterly subtotals.
Expense Tracker
A dedicated sheet for logging and categorizing all business expenses, organized by the standard real estate cost categories: MLS and licensing fees, brokerage split and desk fees, errors and omissions (E&O) insurance, marketing and listing costs, technology and CRM tools, transaction coordination fees, continuing education, and vehicle and travel expenses.
Dashboard
A one-page visual summary showing year-to-date commission income, total expenses, net cash position, and a bar chart comparing monthly income to monthly expenses across the full year.
Real Estate Cash Flow Template Features
- Month-by-month cash flow with real estate-specific income and expense categories
- Commission pipeline tracker with projected close dates and expected receipt amounts
- 12-month annual summary with quarterly subtotals and seasonality visibility
- Expense tracker organized by MLS fees, E&O insurance, marketing, brokerage splits, and tech
- Visual dashboard with income vs. expense chart and pipeline summary
- Ending cash balance calculated automatically each month
How to Use This Real Estate Cash Flow Spreadsheet
Start with the Commission Pipeline sheet. Download the file and open it in Excel or Google Sheets — no macros or plugins needed. Enter every active deal under contract: address, sale price, your commission percentage, and the expected close date. The sheet calculates the expected commission and flags which month the cash will arrive. This step alone usually takes 10–15 minutes and gives you a forward-looking income projection that most agents have never seen in one place before.
Then set up the Monthly Cash Flow sheet. Enter your current cash balance in the starting balance cell, then fill in your recurring monthly expenses — MLS dues, E&O insurance, brokerage fees, CRM subscriptions, and any fixed overhead. As deals close each month, enter the commission received in the income section. The Expense Tracker sheet is the cleanest way to log individual expenses and have them roll up automatically, but you can also enter monthly totals directly if you prefer a simpler workflow.
15 minutes from download to your first cash flow projection
Download the template, enter your active deals and monthly expenses, and see your real estate income and cash position mapped out for the next 12 months.
Why Real Estate Professionals Need a Cash Flow Template
Real estate is one of the few professions where income is entirely event-driven. A salaried employee knows what hits their account on the 15th and last of every month. A real estate agent might close four deals in March, none in April, and two in May — and the expenses keep running regardless. MLS dues, E&O insurance, brokerage fees, CRM subscriptions, and marketing costs don't pause between closings. Without a cash flow tracker, it's easy to spend liberally in a strong month and then scramble to cover basic overhead when the pipeline goes quiet.
The unique challenge in real estate cash flow is the gap between activity and income. An agent can be extremely busy — showing homes, writing offers, negotiating contracts — for 60–90 days before a single dollar arrives. During that time, they're spending on gas, marketing, transaction coordination, and professional development. A commission pipeline tracker solves this by connecting activity to expected cash receipt, so an agent can see that three closings expected in April will generate $18,000, which covers three months of overhead. Without that visibility, the same agent might turn down a listing opportunity in March because the account balance looks low — even though the pipeline is full.
Real Estate Industry at a Glance
Financial templates built for real estate professionals — agents, brokers, property managers, appraisers, and inspectors. Pre-loaded with commission tracking, management fee structures, and transaction-based billing.
Revenue Drivers
- Sales commissions
- Property management fees
- Lease-up / tenant placement fees
- Appraisal & inspection fees
Key Cost Categories
- MLS & licensing fees
- Marketing & advertising
- E&O insurance
- Transaction coordination
- Technology & CRM
- Office & brokerage fees
Typical Margins
Gross: 40-70% · Net: 15-35%
Seasonality
Peak activity spring through summer (March–August); winter slowdown, especially December–January. Commercial real estate has less pronounced seasonality.
Key Performance Indicators
Real Estate Cash Flow Template FAQ
More Real Estate Templates
Real Estate Balance Sheet Template for Excel
$29
Real Estate Budget Template for Excel
$29
Real Estate Business Plan Template for Excel
$39
Real Estate Expense Tracker Template for Excel
$29
Real Estate Financial Model Template for Excel
$29
Real Estate Income Statement Template for Excel
$29
Real Estate Invoice Template for Excel
$29
Real Estate KPI Dashboard Template for Excel
$29
Real Estate P&L Template for Excel
$29
Real Estate Pro Forma Template for Excel
$29
Real Estate Project Budget Template for Excel
$29
Real Estate Sales Forecast Template for Excel
$29
Real Estate Business Valuation Template for Excel
$29
Real Estate Cash Flow Template
$29