Retail P&L Template
Track your store's revenue by channel, cost of goods, and operating expenses with a P&L built for retail — not a generic spreadsheet you have to rebuild from scratch.
What's Inside This Retail P&L Template
This template includes 4 worksheets, each designed for a specific part of your retail financial workflow:
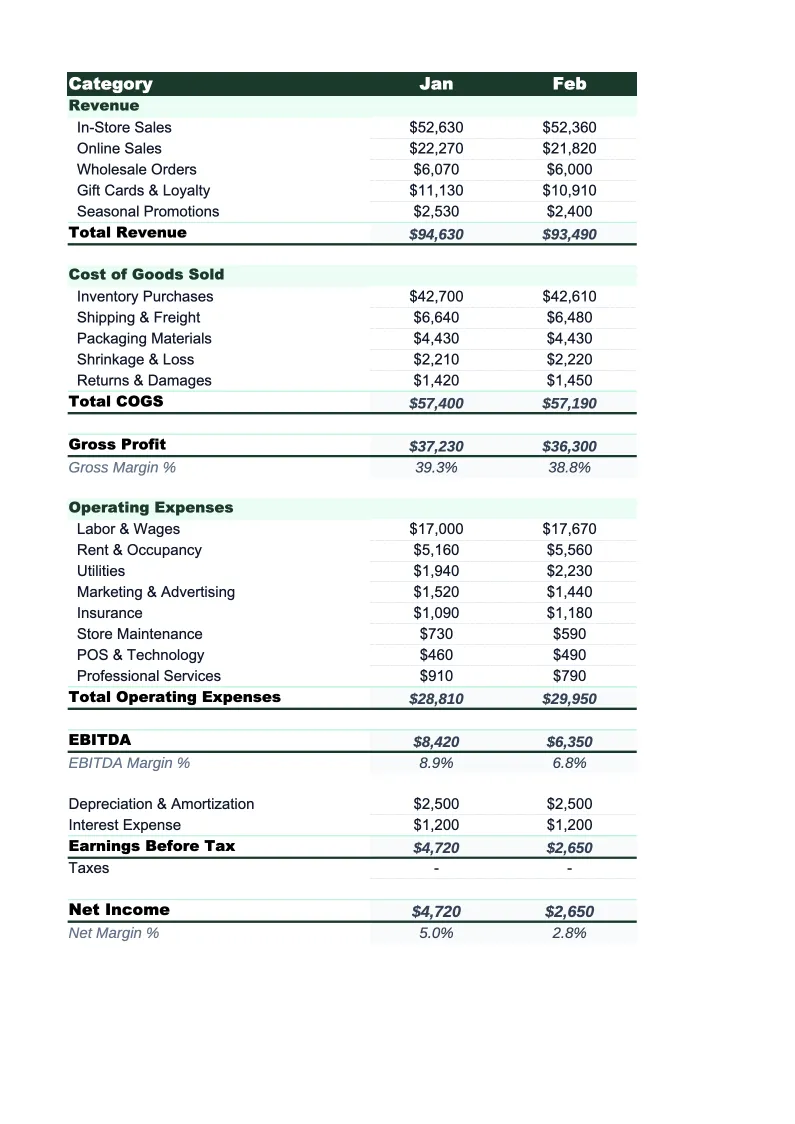
Monthly P&L
The core worksheet for recording each month's revenue and expenses.
Annual P&L
A 12-month view that pulls from the Monthly P&L sheet automatically.
Gross Margin by Category
A dedicated sheet for tracking profitability across your product mix.
Dashboard
A one-page visual summary with pre-built charts and key retail metrics.
Retail P&L Template Features
- Revenue split by channel: in-store, online/e-commerce, and wholesale
- Gross margin analysis by product category or department
- COGS tracked separately from operating expenses
- Labor, rent, shrinkage, and fulfillment costs as individual line items
- 12-month annual P&L view with full-year totals
- Visual dashboard with gross margin %, net margin %, and revenue trends
How to Use This Retail P&L Spreadsheet
Download the .xlsx file and open it in Excel or Google Sheets — no macros or plugins required. Start with the Monthly P&L sheet and review the pre-loaded categories. Most retail stores can use 80–90% of the default line items as-is; the main customization is matching your revenue channels and product categories to your actual setup. If you don't sell wholesale, remove that line. If you carry multiple departments, add them to the Gross Margin by Category sheet. First-time setup typically takes 15–20 minutes.
Once the structure is right, enter your monthly revenue figures from your POS or e-commerce platform and your expense figures from your accounting software or bank statements. The Gross Margin by Category sheet is worth filling in separately: enter revenue and COGS for each product category and you'll immediately see which departments are pulling their weight and which have margin problems. This is often the most actionable output in the first few months of using the template.
15 minutes from download to your first P&L
Download the template, enter last month's numbers, and see your store's gross margin and net income — with category-level profitability calculated automatically.
Why Every Retail Store Needs a P&L Template
Retail is one of the most unforgiving industries for thin margins. Gross margins typically run 40–60%, which sounds healthy until you factor in rent, payroll, shrinkage, and the relentless pressure to discount. Net margins for most retail stores land between 2% and 6% — meaning a 3-point swing in gross margin or an unexpected expense category can eliminate the year's profit entirely. Without a structured P&L to review every month, those margin shifts are invisible until they've already done damage.
A retail P&L has structural requirements that generic templates don't address. Revenue needs to be split by channel — in-store, online, and wholesale behave differently and carry different margin profiles, especially once you factor in shipping costs and platform fees for e-commerce. COGS needs to be tracked by product category, not just as a single blended number, because margin varies dramatically across a retail product mix. And operating expenses need to capture shrinkage as a separate line, since most retail businesses lose 1–2% of revenue to theft and damaged goods annually — an amount that rarely appears clearly in accounting software without deliberate tracking.
Retail Industry at a Glance
Financial templates built for retail businesses — from independent boutiques to specialty stores. Pre-loaded with product cost tracking, wholesale invoicing, and retail-specific KPIs.
Revenue Drivers
- In-store sales
- Online/e-commerce sales
- Wholesale orders
- Custom and special orders
Key Cost Categories
- Cost of goods sold
- Labor (sales staff)
- Rent & occupancy
- Inventory shrinkage
- Marketing & advertising
- Shipping & fulfillment
Typical Margins
Gross: 40-60% · Net: 2-6%
Seasonality
Q4 holiday season typically accounts for 20-30% of annual revenue; back-to-school (August) and spring sales are secondary peaks.
Key Performance Indicators
Retail P&L Template FAQ
More Retail Templates
Retail Balance Sheet Template for Excel
$29
Retail Budget Template for Excel
$29
Retail Business Plan Template for Excel
$39
Retail Cash Flow Template for Excel
$29
Retail Expense Tracker Template for Excel
$29
Retail Financial Model Template for Excel
$29
Retail Income Statement Template for Excel
$29
Retail Invoice Template for Excel
$29
Retail KPI Dashboard Template for Excel
$29
Retail Pro Forma Template for Excel
$29
Retail Project Budget Template for Excel
$29
Retail Sales Forecast Template for Excel
$29
Retail Business Valuation Template for Excel
$29
Retail P&L Template
$29