Auto Repair Cash Flow Template
Track and project cash flow for your auto repair shop — with labor receipts, parts vendor payables, seasonal service fluctuations, and a 13-week projection built around the daily cash cycles and inventory timing that drive shop operations.
What's Inside This Auto Repair Shop Cash Flow Template
This template includes 4 worksheets, each designed for a specific part of your auto repair financial workflow:
13-Week Cash Flow
A rolling 13-week cash projection covering the most actionable planning window for an auto repair shop.
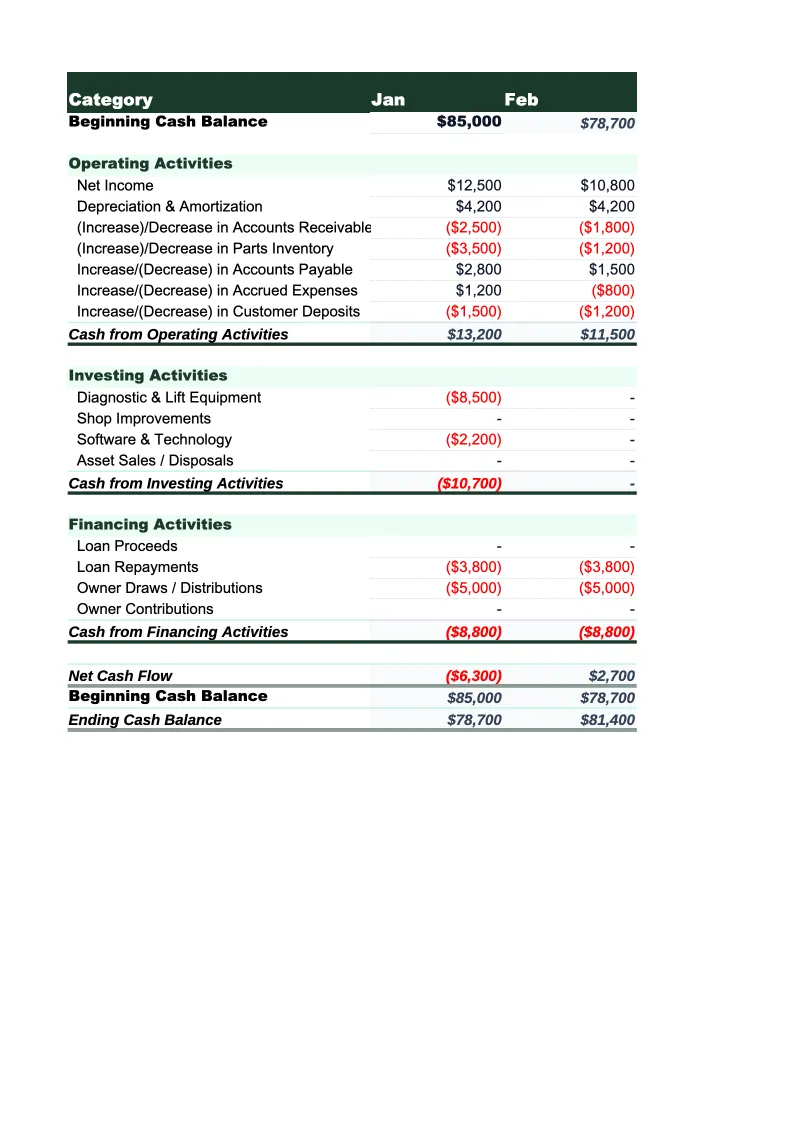
Monthly Cash Flow
A 12-month indirect-method cash flow statement organized into operating, investing, and financing activities.
Parts & Vendor Tracker
A dedicated sheet for managing parts vendor accounts, outstanding AP balances, and parts purchase timing — the primary working capital lever in an auto repair shop.
Annual Summary
A full-year rollup of revenue by service category, operating cash flow, and the KPIs that auto repair shop owners, lenders, and potential buyers use to evaluate a shop's financial health.
Auto Repair Shop Cash Flow Template Features
- 13-week cash projection with inflows split by service type — repair and service work, maintenance and oil changes, diagnostics, and tire and parts sales — so you can see exactly which revenue streams are driving your weekly position
- Parts & Vendor Tracker with AP aging for all vendor accounts, cash due to vendors in the next 30 days feeding into the weekly projection, and automatic parts-to-labor ratio calculation from billing data
- Accounts payable adjustment in the monthly indirect cash flow — capturing the timing difference between when parts are purchased on vendor terms and when cash actually leaves the shop
- Average Repair Order (ARO) and Effective Labor Rate (ELR) calculated automatically in the Annual Summary, showing the two metrics most directly tied to shop revenue performance
- Gross profit per available labor hour calculation connecting technician headcount decisions to actual cash generation — the metric that tells you whether adding a technician improves or dilutes shop profitability
- Seasonal cash flow chart showing the full annual curve across 12 months — with spring and summer peaks and the January-February trough visible so you can plan ahead for the slow season
How to Use This Auto Repair Cash Flow Spreadsheet
Download the .xlsx file and open it in Excel or Google Sheets. Start with the Parts & Vendor Tracker — enter every active parts vendor or supplier your shop uses: the vendor name, payment terms, and current outstanding balance with the oldest unpaid invoice date. For shops with multiple vendors (a main parts distributor like NAPA or O'Reilly on net-30, a specialty parts supplier, and a tire wholesaler), this step takes 15–20 minutes and immediately shows your total parts AP outstanding and how much cash is due to vendors in the next 30 days. Also enter your current inventory positions for fast-moving stocked items — oil, filters, brake pads, belts — with your typical reorder point so the tracker can flag upcoming purchases before inventory runs out and the restock becomes an unplanned cash outflow. This two-part setup gives you a complete picture of your parts-related working capital before you enter a single number in the cash flow sheets.
Move to the 13-Week Cash Flow sheet and fill in weekly inflows and outflows. Use your shop management system or point-of-sale records to pull the last 4–6 weeks of actual collections by service type — repair and service, maintenance and oil changes, diagnostics, tire and parts sales — and enter those actuals in the historical weeks as your baseline. For future weeks, use your appointment schedule and typical weekly car count to project inflows forward. For outflows, enter technician payroll in the weeks pay is actually distributed, enter parts vendor payments in the weeks they're due based on invoice dates and payment terms from the Parts & Vendor Tracker, and enter fixed expenses like rent and insurance on their scheduled payment dates.
15 minutes from download to your first cash flow projection
Download the template, enter your vendor AP balances and weekly car count, and see your shop's full cash picture — 13-week projection, parts tracker, and annual KPI summary included.
Why Every Auto Repair Shop Needs a Cash Flow Template
Auto repair shops run on daily cash — customers pay when they pick up their vehicle, and most shops have zero accounts receivable from retail customers. That same-day payment pattern makes cash flow simpler than businesses running on credit terms, but it also means the shop's cash position is directly tied to car count and ARO rather than invoice management. A shop doing 35 cars per week at a $350 ARO generates roughly $12,250 per week in gross receipts. If car count drops to 28 cars during a slow January week, that's $2,450 less in weekly cash — and payroll, rent, and vendor payments don't flex down with it. The cash flow challenge in auto repair isn't accounts receivable management; it's the seasonal revenue variance against a fixed cost structure, and the timing mismatch between parts purchases on vendor terms and parts revenue received at customer pickup.
The two metrics that most directly control auto repair cash flow are Average Repair Order and Effective Labor Rate. ARO is the average revenue generated per vehicle that comes into the shop. A shop averaging $300 ARO and doing 40 cars per week generates $12,000 per week; the same shop at $380 ARO generates $15,200 — a $3,200 weekly difference without adding a single additional car or technician. ARO increases come from presenting additional recommended services at write-up: a vehicle in for an oil change that also needs brakes and a cabin air filter can generate $450 in one visit rather than $60. ELR measures how efficiently the shop converts technician time into revenue — a shop billing 200 hours per week at a $110 ELR generates $22,000 in labor revenue, while a $130 ELR on the same hours generates $26,000. Most shops with ELR below their door rate are losing the difference on warranty work, comebacks, or flat-rate jobs completed well under book time.
Auto Repair Industry at a Glance
Financial templates built for auto repair shops — from single-bay independents to multi-location service centers. Pre-loaded with labor, parts, and overhead categories specific to the automotive service industry.
Revenue Drivers
- Labor (repair services)
- Parts sales
- Oil changes & maintenance
- Diagnostics & inspections
- Tire sales
- Shop supplies fees
Key Cost Categories
- Parts & materials (COGS)
- Technician labor
- Rent & occupancy
- Equipment & tools
- Utilities
- Insurance
- Marketing & advertising
- Shop supplies
Typical Margins
Gross: 50-60% · Net: 5-15%
Seasonality
Busiest in summer (June–August) and spring (March–May) for maintenance and travel prep; January–February are consistently the slowest months.
Key Performance Indicators
Auto Repair Shop Cash Flow Template FAQ
More Auto Repair Templates
Auto Repair Shop Balance Sheet Template for Excel
$29
Auto Repair Shop Budget Template for Excel
$29
Auto Repair Shop Business Plan Template for Excel
$39
Auto Repair Expense Tracker Template for Excel
$29
Auto Repair Financial Model Template for Excel
$29
Auto Repair Income Statement Template for Excel
$29
Auto Repair Invoice Template for Excel
$29
Auto Repair KPI Dashboard Template for Excel
$29
Auto Repair P&L Template for Excel
$29
Auto Repair Shop Pro Forma Template for Excel
$29
Auto Repair Shop Project Budget Template for Excel
$29
Auto Repair Sales Forecast Template for Excel
$29
Auto Repair Shop Valuation Template for Excel
$29
Auto Repair Cash Flow Template
$29